[ad_1]

marchmeena29/iStock via Getty Images
Investment Thesis
The WisdomTree U.S. High Dividend Fund (DHS) is one of the best opportunities in the dividend ETF space today. With an estimated 3.50% yield over the next twelve months, an ultra-low forward price-earnings ratio of 16x, and some excellent selections to protect against rising inflation rates, DHS is undoubtedly one to watch in the coming months. This article will present the latest fundamental metrics and make the case that if it’s a high yield with a bit of downside protection you’re seeking, DHS is one to buy.
ETF Overview
Strategy & Fund Basics
DHS tracks the WisdomTree U.S. High Dividend Index, a subset of the fundamentally-designed WisdomTree U.S. Dividend Index. The selection process includes identifying the top 30% of U.S. publicly traded companies by their indicated dividend yields and removing the bottom 10% of stocks that score the worst based on WisdomTree’s proprietary scoring system. The Index also removes the top 5% of stocks by dividend yield if they fall in the bottom half of their ranking system to avoid potential yield traps. This system is quality-focused, with metrics like return on equity, return on assets, gross profits over assets, cash flow over assets, and risk-adjusted total returns considered.
The Index is dividend-dollar weighted, a modified market-cap-weighting method that looks at total future aggregate dividends. This method gives a little extra allocation boost to stocks like Pfizer (PFE), DHS’s second-largest holding, whose yield is less than 3%. Below are some descriptive statistics I’d like to highlight before looking at the fund’s composition.
- Current Price: $84.93
- Assets Under Management: $878 million
- Expense Ratio: 0.38%
- Launch Date: June 16, 2006
- Trailing Dividend Yield: 3.18%
- Five-Year Dividend CAGR: 4.41%
- Ten-Year Dividend CAGR: 5.32%
- Five-Year Beta: 0.86
- Number of Securities: 314
- Portfolio Turnover: 43%
- Assets in Top Ten: 43.55%
- 30-Day Median Bid-Ask Spread: 0.12%
- Tracked Index: WisdomTree U.S. High Dividend Index
I want to remind readers that these are the ETF’s latest statistics and should not be confused with the statistics for the fund’s current constituents. As I will demonstrate later, they’re much different today, and quite frankly, better.
Sector Exposures and Top Holdings
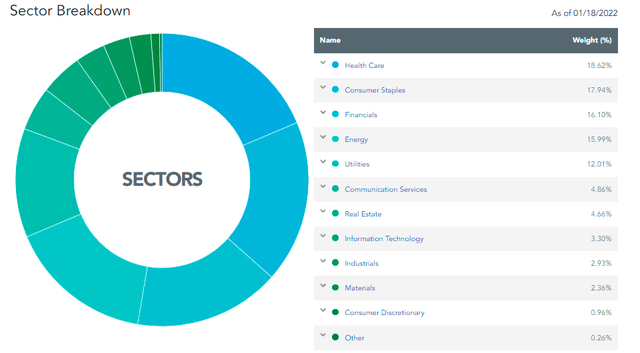
DHS mostly holds stocks in five sectors: Health Care (18.62%), Consumer Staples (17.94%), Financials (16.10%), Energy (15.99%), and Utilities (12.01%). A key part of my bullish thesis is based on how much I currently favor these sectors, so long as they don’t include many overpriced stocks. As I discussed in my recent article on the Vanguard Consumer Staples ETF (VDC), stocks like Costco (COST) and Walmart (WMT) aren’t attractive at the moment due to their high price-earnings ratios. DHS avoids these types of stocks and instead focuses primarily on value plays with forward price-earnings ratios less than 20.
WisdomTree DHS Overview
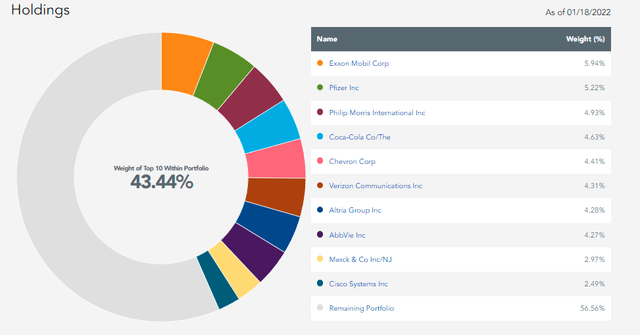
Even though DHS has 314 holdings, the top ten make up a sizable 43.44% of the ETF. In my fundamental analysis later, I’ll be looking at metrics for the top 20 holdings, which total 60.05%. As shown below, Exxon Mobil is the top stock with a weighting of 5.94% and, in my view, represents an excellent inflation hedge. Next is Pfizer, which has a near-perfect Quant Rating according to Seeking Alpha. Finally, in third place, we have Philip Morris (PM), which provides one of the highest and safest dividend yields in the U.S. market.
WisdomTree DHS Overview
DHS Performance
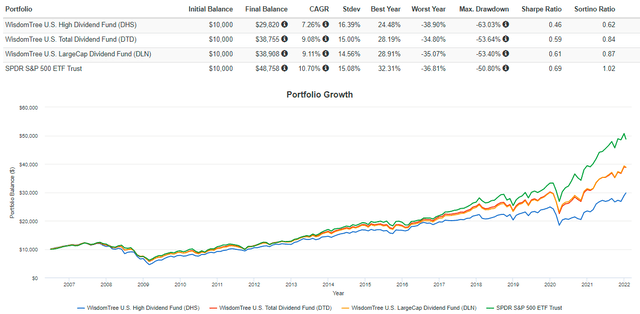
DHS has been the worst-performing ETF out of WisdomTree’s three domestic large-cap funds since its inception in June 2006. Annualized returns were just 7.26% compared to 9.08% for the WisdomTree U.S. Total Dividend Fund (DTD) and 9.11% for the WisdomTree U.S. LargeCap Dividend Fund (DLN). All underperformed by SPDR S&P 500 Index ETF (SPY), though, with most of that underperformance coming during the pandemic.
Portfolio Visualizer
However, I caution against reading too much into past performance since growth stocks have largely outperformed value and dividend stocks during that period. DHS also had a fair amount of turnover over that time, and with the Invesco QQQ ETF (QQQ) down 7% this year, investors are starting to punish richly-valued stocks and reward cheaper, more defensive ones. On that note, let’s take a look at DHS’s fundamentals.
Fundamental Analysis
I’ve divided this fundamental analysis into two sections. First, a snapshot of the fund’s top 20 companies, which I think does a good job explaining the valuation, dividends, and potential growth. Second, a snapshot of DHS’s top 20 industries. I find this helpful because often, investors assume that since DHS has over 300 holdings, it’s just a market fund with weights adjusted in favor of dividend stocks. They’re surprised that the DHS is remarkably concentrated when you break it down, with the top 20 industries covering 85% of the ETF.
DHS Snapshot By Company
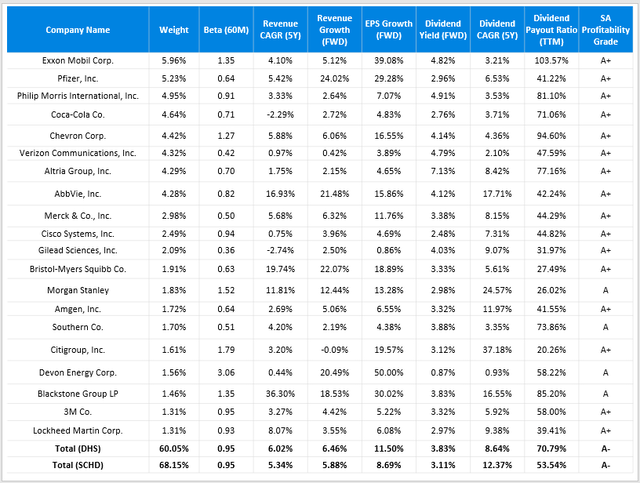
Before I begin, I want to mention how important it is to have a benchmark. Without referencing another fund that you know is solid in the long run, the numbers below mean little. For DHS, I have decided to compare it with what I consider to be the best dividend ETF on the market today: the Schwab U.S. Dividend Equity ETF (SCHD). SCHD is one of the few dividend ETFs to deliver market-like returns alongside a yield about twice SPY’s. Its screens are logical, and the ETF has grown dividends at an incredible 12.32% annualized rate over the last five years. Let’s see how DHS matches up with it.
Created By Author Using Data From Seeking Alpha
First, I want to mention that both funds are pretty concentrated in their top 20 holdings. This is the nature of the dividend-dollar-weighted method, as market capitalization differences can be huge compared to differences in, say, yields. If investors are interested in something closer to an equal-weight approach, weighting based on factors like volatility or yield should get you there.
Second, the two ETFs both have a five-year beta of 0.95. This figure contradicts the 0.86 I mentioned for DHS earlier, and the reason is because of the fund’s turnover rate. The statistics in the table above are weighted to each fund’s current constituents; I find this more valuable, as I’m not as interested in how former stocks moved relative to the market.
Third, I was surprised to find DHS has better revenue and EPS growth rates than SCHD. Usually, this isn’t the case for high-yield funds since value stocks are often slow-growing ones. In regards to DHS, the market has only begun to recognize this. Profitability isn’t an issue either, as evidenced by the two fund’s identical Seeking Alpha Profitability Grades.
The only disadvantage is DHS’s high 70% dividend payout ratio. However, a lot is due to sector and industry composition differences. SCHD, for example, is about 20% Technology compared to 3% for DHS. SCHD has high allocations to stocks like Cisco Systems (CSCO), Broadcom (AVGO), and Texas Instruments (TXN), all of which have payout ratios around the 50% range. In contrast, DHS has 12% exposure in capital-intensive Utilities stocks, while SCHD has no exposure here. In my view, payout ratios can be a little higher in this sector and still not be an issue.
DHS Snapshot By Industry
At the industry level, you can see how similar the two ETFs are at both the concentration in the top 20 and by their weighted-average market capitalizations. This occurs despite DHS holding more than 200 additional securities. However, they differ with their compositions, and it’s clear that DHS has the edge on SCHD in terms of valuation and momentum.
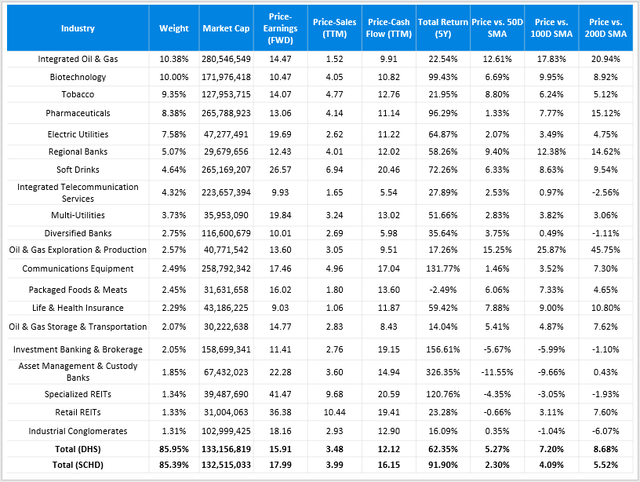
Created By Author Using Data From Seeking Alpha
Notice how DHS’s forward price-earnings ratio of 15.91 is a couple of points cheaper than SCHD’s 17.99. We can also see that DHS is cheaper based on the price-book and price-cash flow ratios. However, the weighted-average five-year returns for current constituents are much better for SCHD. A lot is caused by weak historical performance in the Integrated Oil & Gas Industry. DHS has a 10.38% weighting in this industry, while SCHD has zero. If you’re concerned about inflation, as I am, this is where SCHD and its 2% allocation to Energy stocks fall flat.
To illustrate, I’d like to borrow a graph I prepared for my article on the iShares Core High Dividend ETF (HDV), which has beaten SPY by about 7% since its publication three weeks ago. The graph looks at correlations between Exxon Mobil’s excess returns over SPY and the average annual inflation rate changes since 1994. It’s clear that when inflation rises from the previous year, Exxon outperforms, and vice versa. Having this industry exposure as a hedge, in my view, is appropriate.
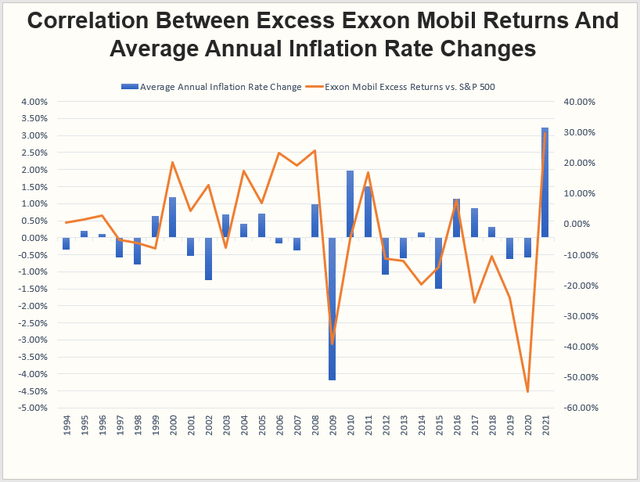
Created By Author Using Data From The U.S. Bureau of Labor Statistics
Investment Recommendation
The WisdomTree U.S. High Dividend Fund makes sense from a valuation, growth, and yield perspective. It beats SCHD, one of the best dividend ETFs around, on most metrics I analyzed. Importantly, its composition is different enough such that you won’t get too much overlapping. It serves as an efficient add-on to a core holding and an excellent inflation hedge should oil prices keep rising.
I view high-dividend ETFs as satellite products, and I often don’t recommend them because I know that total return is sacrificed for yield most of the time. However, this won’t always be true, and if high-dividend ETFs are appealing to you, I think DHS is a nice fund to own right now. The forward indicated yield of 3.83%, combined with the fund’s 0.38% expense ratio, should leave investors with a yield in the 3.50% range. I’m looking for this fund to outperform other dividend ETFs in the near term and plan to provide an update next quarter.
[ad_2]
Source link Google News

