[ad_1]
Over the last week, the iPath S&P GSCI Crude Oil Total Return Index (OIL) has fallen by about 5% bringing the year-to-date gain to around 20%. The reasons for the fall have been largely attributed to tweets from President Trump as well as macroeconomic concerns regarding the Federal Reserve cuts. Despite the immediate bearish sentiment in the OIL ETN, I believe that now is an excellent time to buy the note in anticipation of a price rally that I believe will last throughout the rest of the year.
The Instrument
Let’s start with a discussion of what exactly the OIL ETN is. OIL is an exchange-traded note which tracks the S&P GSCI Crude Oil Total Return Index. As an exchange-traded note, the actual instrument you buy or sell is based on senior debt notes which means that you are exposed to the creditworthiness of the institution against which you trade. Another key difference between ETNs and ETFs is that an ETN has no tracking difference because no underlying trades are happening in the commodity-based on positions in the notes (unless the counterparty hedges exposure). With ETFs, you can have small tracking errors which accumulate over time and with ETNs you can circumvent this situation entirely by trading something which is marked to a methodology. This basically means that OIL is tracking the S&P GSCI Crude Oil Total Return Index with a small fee tacked onto the fund for administrative expenses, with no worry of tracking error all in exchange for some credit risk. The key question for understanding OIL essentially boils down to understanding the S&P GSCI Crude Index and its specific methodology.
The S&P GSCI Crude Index is an index created by S&P which seeks to give a production-weighted exposure to Brent and WTI crude oil futures contracts on an ongoing basis. The basic idea behind the index is that it provides a single benchmark as per how global crude is performing.
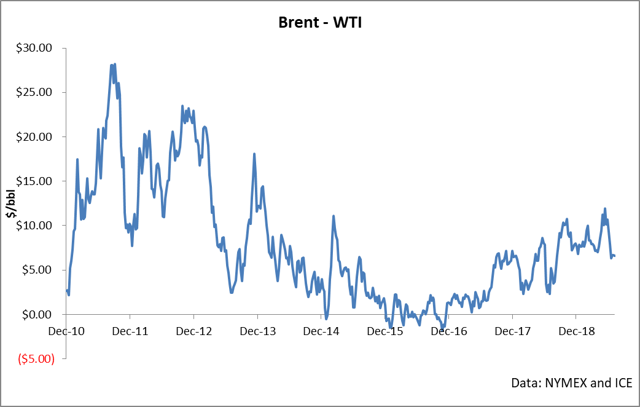
If you’re familiar with the nuances of the crude markets, you are likely aware of the limitations of this index. For one, Brent and WTI are relatively similar barrels of crude oil and don’t accurately represent the prices and trends of heavy and sour crudes, which means that you really aren’t gaining the full exposure the instrument seems to indicate. For another, Brent and WTI are highly correlated instruments. These instruments are so correlated that traders think in terms of differentials and movements of a few dollars per barrel are expected over the course of several weeks to months as seen in the following chart.

Perhaps the most problematic aspect of the S&P GSCI Crude Index is the simple structural fact facing all instruments, which give exposure to futures markets: roll yield.
When you buy something that trades like a stock (in perpetuity) that gives exposure to the futures market, understanding the rolling methodology is pivotal to understand where a substantial portion of the return of the instrument will be coming from. Put simply, roll yield is the gain or loss associated with holding a position in the futures market in months further back on the curve than the prompt month. There is a basic feature of futures markets in that as time progresses, positions established in the back of the curve tend to trade towards the value of the contracts in the front of the curve as seen in this chart pulled from Wikipedia.
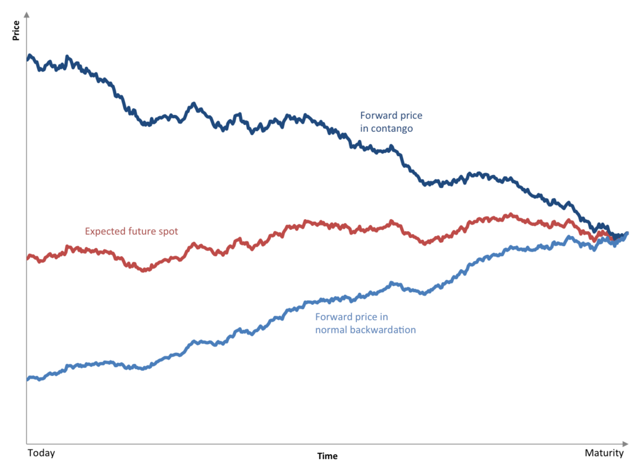
The implications of this relationship are pretty clear: when the market is in backwardation, roll yield on a long position will be positive because positions established at lower prices will trade up in value in relation to the front of the curve. When the market is in contango, the roll yield on a long position will be negative because positions established at higher prices will trade down in value towards the prompt contract as time progresses. This relationship can result in substantial differences between the return you may have expected by taking the difference in price between two points in crude oil’s history and what you actually earned from holding a fund which rolls exposure.
For holders of OIL, roll yield has recently turned strongly bullish. With a strong movement in the front of the curve today, the market has resoundingly switched into backwardation in the front months of the WTI futures contract – a condition which is fairly rare (78% of all months in the last decade have been in contango). As seen here, the front contract settled $0.08/bbl over the next contract out which means that OIL’s monthly rolling process will be reaping positive yield as long as this continues. On the Brent piece of OIL, the market has been backwardated for quite some time which means that overall ETN returns will now see a strong effect of positive roll yield from each instrument.
Roll yield in and of itself is not the only reason why I recommend buying OIL, but there are a number of systematic strategies which would allocate capital purely based upon roll and capturing this feature of the futures market. The primary reason why I recommend OIL really boils down to one thing: fundamentals.
Fundamentals
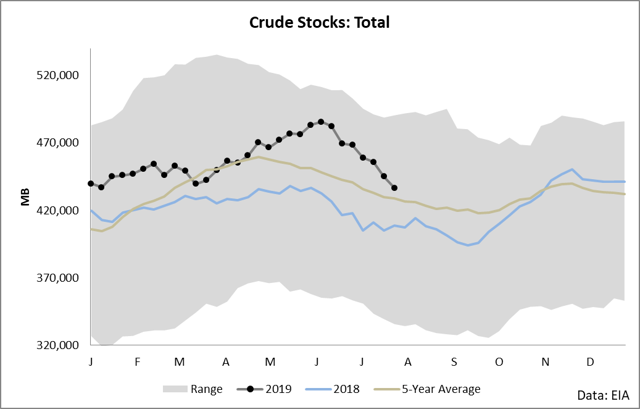
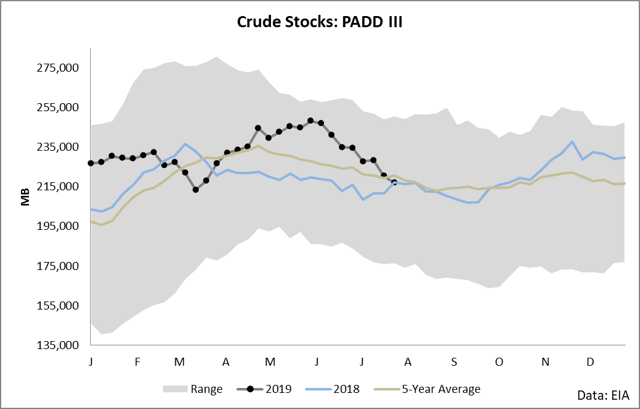
The crude oil markets have witnessed a substantial strengthening in the bullish case over the past few weeks as crude inventories have simply collapsed against the 5-year average.
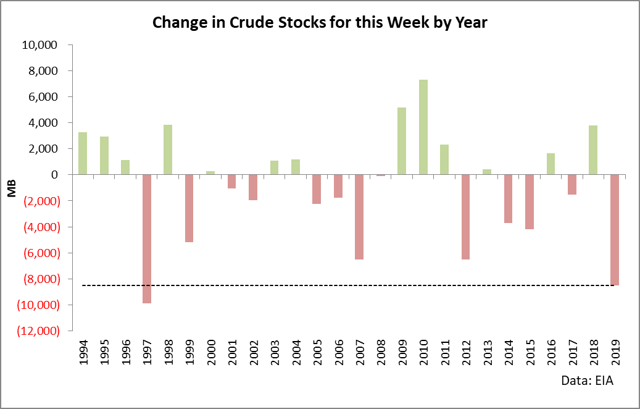
The last week was truly noteworthy in the EIA’s data set in that it was the largest draw seen for that week of the year since 1997.
The recent draws have pulled PADD 3 inventories below the 5-year average which is highly important in that PADD 3 is the primary refining center and this is indicative of supply not being able to keep up with demand in the region.
What is noteworthy is that these draws in stocks come in the face of rather lackluster pure refining demand as expressed through utilization.
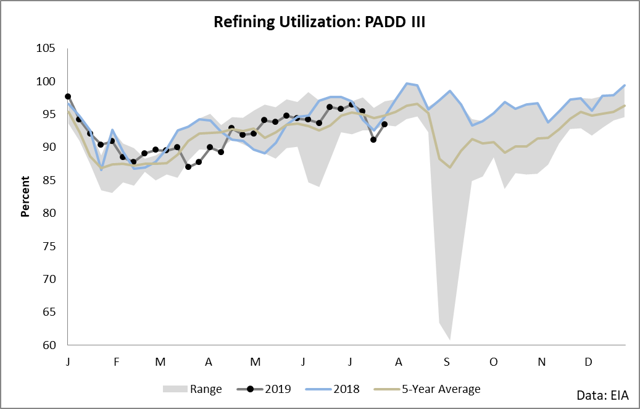
In other words, the problem is on the supply side. The primary reason for these cuts is pretty simple: imports have collapsed.
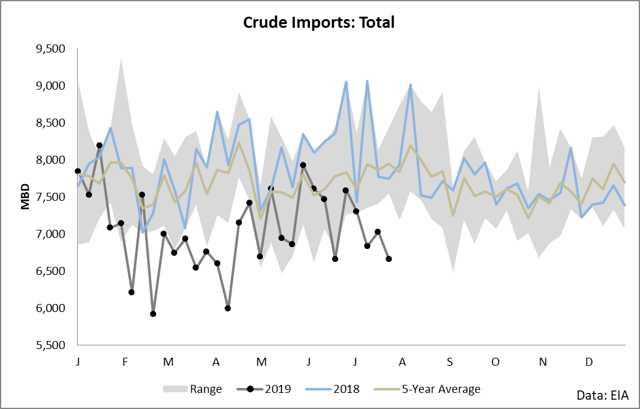
On a year-to-date basis, imports into the United States have been the lowest level seen in several decades and OPEC is the culprit.
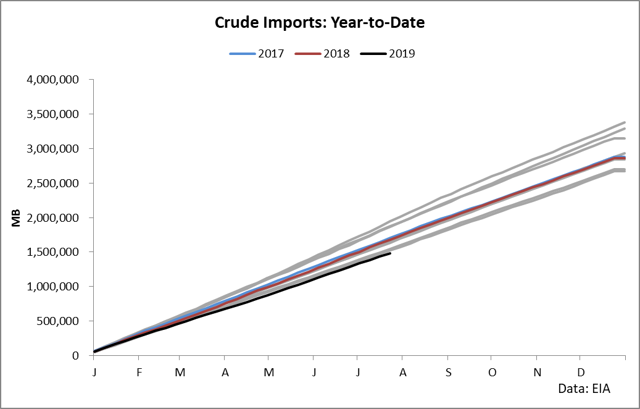
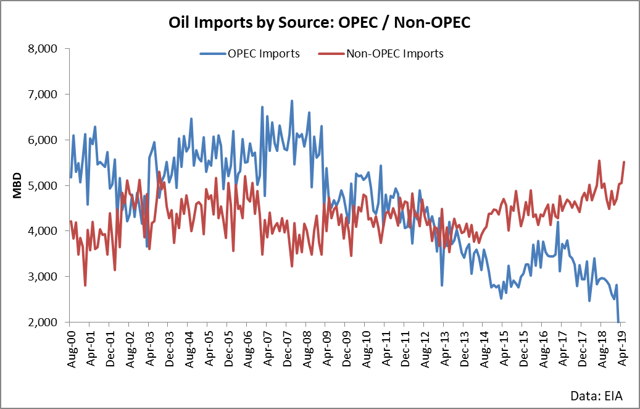
OPEC recently extended cuts at its mid-year meeting, which means that the bullish decline of imports into the United States will continue through at least March 2020. OPEC supplies a substantial percentage of the global barrels and the United States is highly dependent on its barrels for balancing North American crude. As long as these cuts continue, we will most likely see higher prices with only brief periods of sell-offs. I believe we are in such a period and buying OIL now represents a solid trade to capture this thesis.
OIL also gives exposure to Brent and Brent is strongly impacted by OPEC’s cuts. The Brent backwardation levels have remained elevated this year on the back of OPEC cuts which means that with OPEC volumes removed from the market, there is a higher demand for Brent barrels. This will continue through March of next year which will be a positive roll yield for OIL as well as upside price appreciations as supply struggles in the face of demand. It’s a great day to buy OIL.
Disclosure: I/we have no positions in any stocks mentioned, and no plans to initiate any positions within the next 72 hours. I wrote this article myself, and it expresses my own opinions. I am not receiving compensation for it (other than from Seeking Alpha). I have no business relationship with any company whose stock is mentioned in this article.
[ad_2]
Source link Google News

