[ad_1]
ETF Overview
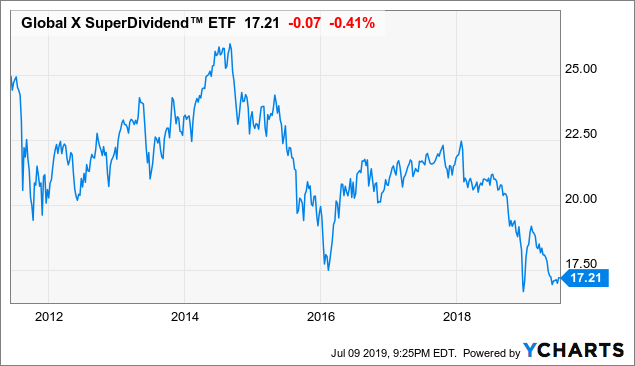
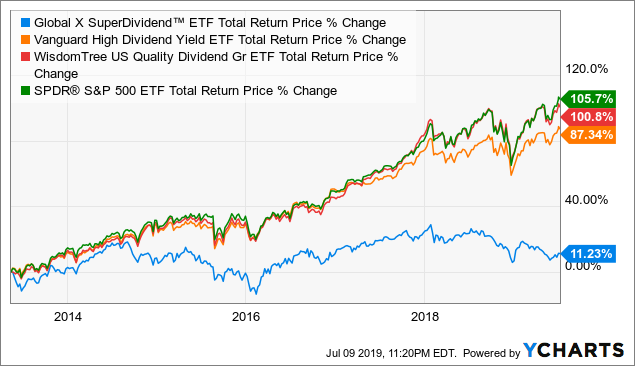
Super Dividend ETF (SDIV) focuses on 100 of the highest-yielding stocks in the world. However, SDIV’s selection methodology has resulted in lower-quality companies in its portfolio. Therefore, the fund tends to underperform in both a bear and a bull market. Although investors get an attractive dividend with a high dividend yield, its total return over the long-term is not attractive. Therefore, we recommend investors seek opportunities elsewhere.
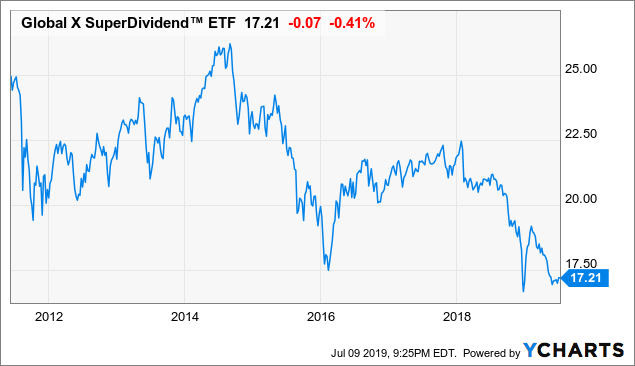
Data by YCharts
Fund Analysis
Portfolio construction ensures high dividend yields but may include lower quality companies
SDIV constructs its portfolio by picking the 100 highest yielding stocks from a list of stocks in the world that meet the minimum liquidity requirement. These 100 stocks are equally weighted to prevent exposure to one single stock. The index also reviews the portfolio every quarter to ensure the dividend outlook of the stocks included are not negative. If there was a dividend cut to a stock, or if the dividend outlook turned negative, this stock will be removed and replaced with the next highest yielding stock.
For income investors, the good side of this strategy is obvious. The dividend yield of this ETF will remain very high as the portfolio is reviewed and rebalanced every quarter. However, there are often reasons why a stock will have a high dividend yield. The first reason is that the stock may have a high payout ratio as the company pays out most of its earnings to its shareholders as dividends. This means that the company does not have a high margin of safety. If its earnings decline, the company may be forced to cut its dividend. Second, high dividend yield is often a result of share price weakness. The market may be concerned about something with this stock such as its negative growth outlook, or its deteriorating balance sheet. Therefore, this approach may end up including lower quality companies.
SDIV has a high exposure to small-cap and mid-cap companies
Unlike many other dividend ETFs, SDIV’s portfolio construction methods do not screen out small and mid-cap stocks. As can be seen from the table below, mid-cap and small cap stocks represent 28.2% and 52.8% of SDIV’s portfolio respectively. Unlike large-cap stocks, which generally have an established business and much stronger balance sheets, small and mid-cap stocks may be more fragile in an economic downturn. An economic downturn may quickly result in negative earnings growth. Therefore, SDIV will likely exhibit higher volatility than many other dividend ETFs that are mostly exposed to large-cap stocks.

Source: Morningstar
High exposure to cyclical sectors
The fund has a high exposure to cyclical sectors. These sectors include mortgage REITs, financials, industrials, materials, and energy sectors and they make up more than 50% of SDIV’s portfolio.
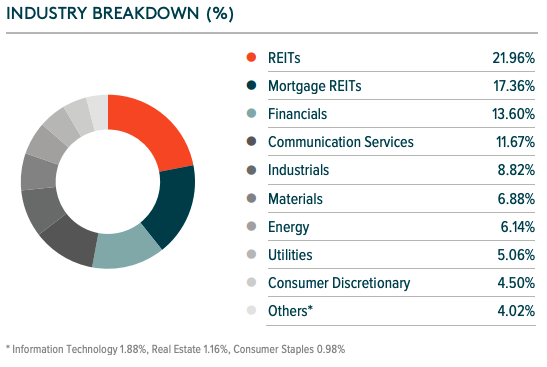
Source: SDIV Factsheet
As we know, cyclical sectors can perform quite well when the global economy is booming. However, it can perform poorly when the economy is contracting. The current economic cycle has been well into its 10th year. However, the uncertainty surrounding the trade tensions lately has reduced business confidences considerably. This is already evident in the Global Purchasing Managers Index (often a leading economic indicator) where it has fallen from nearly 55 in early 2018 to 51.20 in June 2019. Therefore, SDIV may not perform well in the next few quarters unless we see a sign of reversal of the global composite PMI.
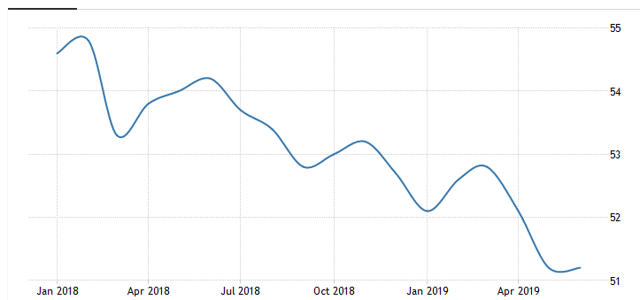
Global Composite PMI (Source: Trading Economics)
Investors may want to consider other dividend yield ETFs
Below is a table that compares the valuation of SDIV to other dividend stocks such as Vanguard High Dividend ETF (VYM) and WisdomTree US Quality Dividend Grade ETF (DGRW), and to S&P 500 Index. For reader’s information, DGRW includes stocks that are tilted towards dividend growth. On the other hand, VYM includes stocks that are tilted more towards dividend yield.
|
SDIV |
VYM |
DGRW |
S&P 500 Index |
|
|
Forward P/E Ratio |
10.2x |
13.1x |
15.7x |
17.8x |
|
Dividend Yield (%) |
9.40% |
3.65% |
2.73% |
2.01% |
|
Sales Growth (%) |
1.49% |
4.63% |
7.02% |
7.12% |
|
Cash Flow Growth (%) |
-6.31% |
9.06% |
14.40% |
13.37% |
Source: Morningstar, Created by author
Given SDIV’s solely focus on yield, we are not surprised to see SDIV has the highest dividend yield than other ETFs and index in the table above. However, SDIV’s average sales growth rate of 1.49% is the lowest among the group. VYM and DGRW have sales growth rates of 4.63% and 7.02% respectively. SDIV even have negative cash flow growth rate of 6.31%. This is a sharp contrast to VYM’s 9.06% and DGRW’s 14.40% growth rates. This tells us that the quality of SDIV’s portfolio is poor compare to VYM and DGRW. This is also evident in its past performance when compare to its peers. As can be seen from the chart below, SDIV only generated a total return of 11.2% since its inception in 2013. This is significantly below VYM’s 87.3%, DGRW’s 100.8%, and S&P 500 Index’s 105.7%.
Data by YCharts
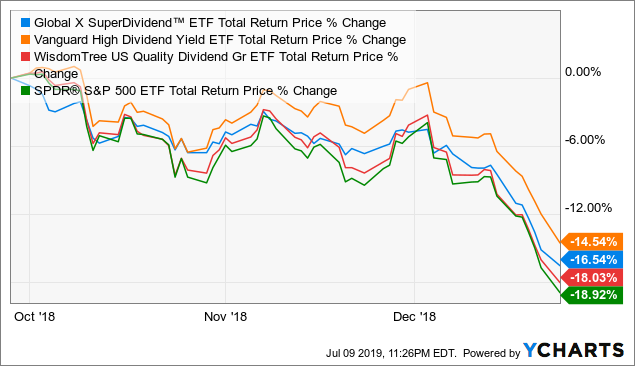
One might think that this fund will outperform its peers in a bear market given the fact that it has a much lower P/E ratio than its peers. Its average forward P/E ratio of 10.2x is significantly below VYM’s 13.1x and DGRW’s 15.7x. Unfortunately, given its high exposure to cyclical sectors, this fund will likely perform poorly in an economic downturn. Although we have not yet experienced a bear market since SDIV’s inception in 2013, last year’s stock market correction offers some glimpse to how this fund might perform in a bear market. As can be seen from the chart below, SDIV’s total return of negative 16.5% is only slightly better than DGRW and S&P 500 Index but worse than VYM’s negative 14.5%.
Data by YCharts
Investor Takeaway
We see little reason to own SDIV as its approach to construct the portfolio of stocks will result in poor quality stocks. Although its average yield is high, its total return is inferior than many of its peers. We think investors are better off seeking opportunities elsewhere or invest in better quality high dividend ETFs such as VYM.
Disclosure: I/we have no positions in any stocks mentioned, and no plans to initiate any positions within the next 72 hours. I wrote this article myself, and it expresses my own opinions. I am not receiving compensation for it (other than from Seeking Alpha). I have no business relationship with any company whose stock is mentioned in this article.
Additional disclosure: This is not financial advice and that all financial investments carry risks. Investors are expected to seek financial advice from professionals before making any investment.
[ad_2]
Source link Google News

