[ad_1]
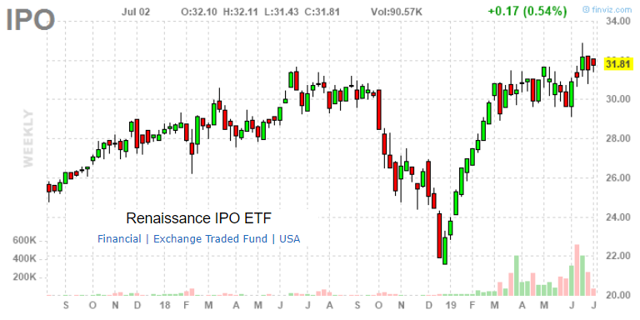
The Renaissance IPO ETF (NYSE:IPO) is an easy way to gain exposure to stocks that recently began trading following an initial public offering. The tracking index adds new companies on a quarterly basis while removing those that have been publicly traded after two years. The idea here is that these new companies are typically in an early stage of growth and may represent a new product or service segment with significant upside potential.
Investors can gain access to the latest trends in the market through a constructed portfolio minimizing single-stock risk. The fund manager Renaissance also describes IPO’s ability to diversify investor holdings as the underlying stocks are not typically included in other indexes or ETFs. Recognizing that the ETF serves an important function in the market, I am bearish on IPO based on what I believe to be exuberant valuations for a number of the underlying components. This article provides reasons to avoid this ETF.
Long Run Underperformance Of IPOs
One of my criticisms of IPO is that the concept is not backed by quantitative or academic research. Consistent winners from IPOs are the insider shareholders or investors able to receive an allocation of shares at the offering price. Data shows that “initial public offerings” have a statistically positive return on the first day of trading relative to the offering price but end up significantly underperforming the market over the next three years.
Based on IPOs between 1980 and 2016 collected by finance professor Jay Ritter from the University of Florida, the average first day performance of IPOs from the offering price is upside of 17% over 8,252 stocks during the period. Considering a three-year holding period, the group returned on average 21.9% (a compound annual growth rate of 6.8%) from the offering price. This compares to a 40.3% (12% CAGR) return for the market, with IPO’s underperforming by -18.4% (21.9%-40.3%). When adjusted for style factors like “value” and “growth” stocks, the underperformance is a smaller at -7.6%.

“initial public offerings” performance 1980-2016. Source: Jay Ritter U of Florida
The chart below shows the Invesco Na ETF Nasdaq ETF (NASDAQ:QQQ) used as a reference here given its high-growth tech focus, against the return of the Renaissance IPO ETF since the fund’s inception data back in October 2013. QQQ is up 152.3% in total return against a 61.9% for IPO. Also consider that this is gross of management fees. IPO’s expense ratio at 0.60% is above QQQ’s at 0.20%. Net of fees, the spread here is greater. The point here is that history and the data is stacked against this ETF. It serves a purpose in packaging recent IPOs in an ETF but this hasn’t been a winner.
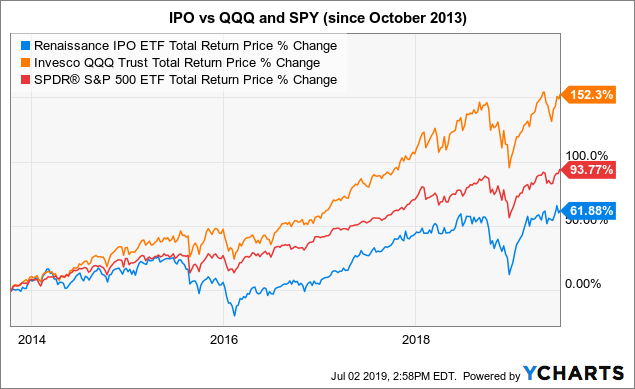 Data by YCharts
IPO has trailed QQQ over a 5-year, 3-year, and 1-year period based on cumulative total returns although a stronger showing this year is helping to catch up. Looking at more recent periods, IPO is beating the market and QQQ year to date 2019 but still lagging over the previous year.

IPO and QQQ cumulative performance. Data by YCharts/table author
A couple of reasons are often cited in attempting to explain the phenomenon of the long run underperformance in IPOs. There is some evidence that bankers typically under-price initial public offerings, creating the appearance of excess demand, ensuring that first day bounce by that will make the insider happy and possibly lead to future banking relationships. Another dynamic discussed by researcher Jay Ritter is overall “excessive optimism”:
One explanation for the poor-long run performance of IPO’s is that investors who are most optimistic about an IPO will be the buyers. If there is a great deal of uncertainty about the value of an IPO, the valuations of the most bullish investors may be much higher than those of pessimistic investors. As time goes on and more information about future performance becomes available, the divergence of opinion between optimistic and pessimistic investors will narrow and consequently the market price will drop.
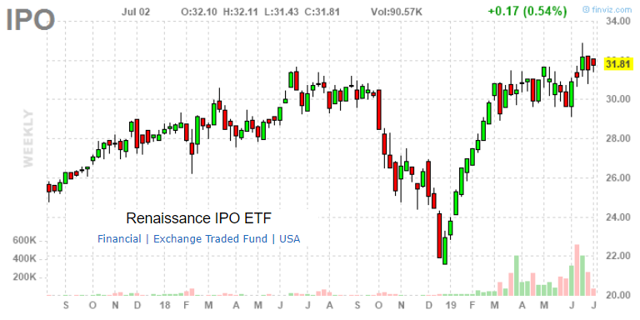
I like this explanation and see parallels to the recent performance of the IPO ETF that is up 37% in 2019. The reality is that IPOs are oftentimes speculative and high risk. Some of the stocks may represent great companies, but that same excessive optimism reflected in an expensive stock price may limit the value as an investing opportunity. That’s the case today with the Renaissance IPO ETF in my opinion, the composition includes some good companies, but overall valuations are just too expensive.
Renaissance IPO ETF Analysis
The current holdings of IPO include 64 stocks all with an IPO date within the past two years. Given the strategy of regular rotation among new IPO and deletions of stock that have traded publicly for 2 years, the turnover ratio is an exceptionally high 194%. There is also a heavy concentration in technology at 56% of the fund by sector exposure.

IPO Key Stats. Source: YCharts
Of the 64 current holdings, 29 have traded for less than 1 year. Another 17 stocks will be removed by the end of the year as they are approaching the 2-year limit. The fund is also able to add major IPOs of significance on a “fast entry” basis in-between quarterly reviews. Take a look at the table below presenting performance and valuation metrics for the underlying stocks (click image to zoom in).
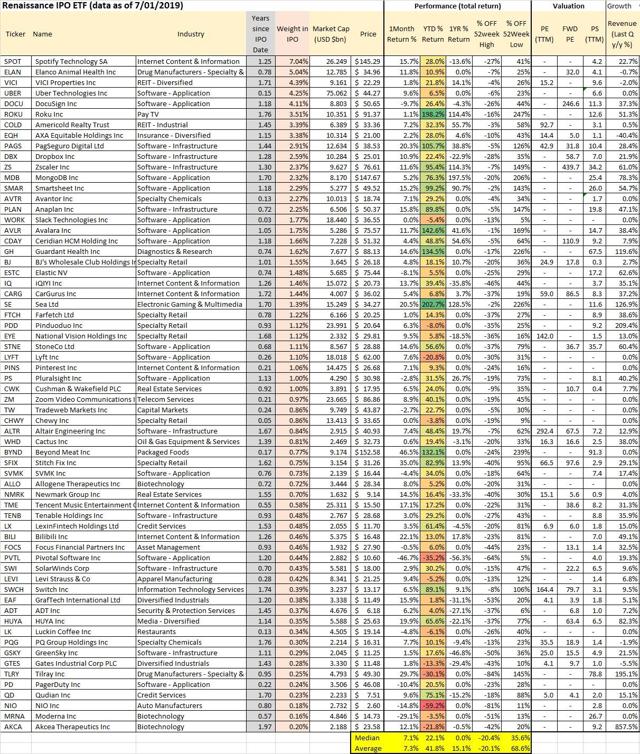 IPO underlying holdings metrics. Data by YCharts/table author
Note that the performance data for the recent IPOs above is based on the “debut” or opening price. With year-to-date returns highlighted, IPO features some big winners that have been up significantly. Sea Limited (NYSE:SE) is the best-performing stock this year, up 203%, closely followed by ROKU Inc. (NASDAQ:ROKU) 198%. Vegan meal producer Beyond Meat Inc. (NASDAQ:BYND) makes the top 5 at up 132% since its IPO. The variety of companies from diverse industries is a curiosity here.
It’s really a mixed bag in IPO that reflects current trends in the markets. What all the companies have in common is that the insiders, for a variety of reasons, felt it was the right time to raise capital by selling the equity. This creates a feedback loop where one company launches an IPO sort of opening the door for peers to follow, emboldened by the strong performance. This year, LYFT Inc. (NASDAQ:LYFT) beat out larger competitor UBER Technologies (NASDAQ:UBER) with an IPO just weeks apart. These stocks have been volatile in early trading, but otherwise supported by the strong market.
One of the trends over the past few years has been the strong performance of application software companies and recent IPOs from the industry. This group includes companies like Avalara Inc. (NASDAQ:AVLR) up 142% YTD and Smartsheet Inc. (NYSE:SMAR) up 99.2% YTD. The story is exceptional growth as the business model scales quickly with potentially viral adoption among users. This industry group of 22 stocks represents 36% of the ETF weighting. 6 stocks here are up nearly 100% in 2019. 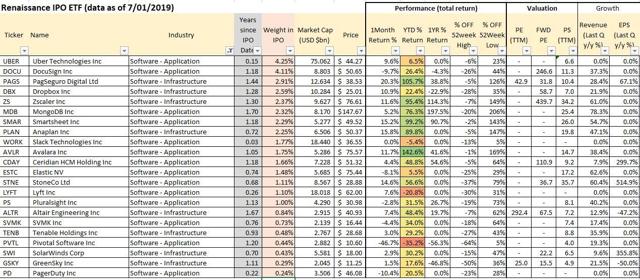 IPO software industry holdings. Data by YCharts/table author
My concern with this group, and as it relates to the broader fund comes down to valuation. Only 3 of the 22 software names in IPO have reported positive EPS over the trailing 12-month period. Considering the most comparable valuation metric to be price-to-sales, this sub-group average is 14x, objectively richly priced by most measures. The average P/S ratio for the entire 64 holdings in IPO is 10x. The only way to justify these levels of multiples is to have enough confidence that the company will be able to grow sales and earnings sufficiently down the line, in order for the ratios to normalize. I’m skeptical.
In some cases, the investment thesis for a company like MongoDB Inc. (NASDAQ:MDB) is pricing in aggressive estimates 10 years out. Current consensus estimates suggest the company may earn a profit in 2021 of $0.22 implying a 3-year forward P/E of 682x. The appearance is that the entire ETF has been bid up on extreme exuberance. My view is that the holdings of IPO on average are priced for perfection in a best-case scenario. There is just too much uncertainty to be getting it at current levels for most of the names in IPO. Even if you’re extremely bullish on some of the names, having exposure to everything is not necessary. Tilray Inc. (NASDAQ:TLRY) and NIO Inc. (NYSE:NIO), each down over 80% from their all-time highs are examples of what can go wrong.
Conclusion
IPOs are a fascinating part of the market but not made for a semi-active vehicle like the Renaissance IPO ETF. The concept of the ETF is flawed in my opinion because the turnover is so high, the investment profile changes significantly every quarter. The “hot IPO” trends of this month could be the laggards of tomorrow. I rate IPO as a sell at current levels. Conceding that some of the stocks in the fund are fundamentally solid and others may well continue higher, I believe that among the 64 holdings the quality is overall low and valuation too expensive. Please take a look at the fund prospectus for a full list ofble risks and disclosures.
Disclosure: I am/we are short IPO. I wrote this article myself, and it expresses my own opinions. I am not receiving compensation for it (other than from Seeking Alpha). I have no business relationship with any company whose stock is mentioned in this article.
[ad_2]
Source link Google News

