[ad_1]
The Invesco QQQ (QQQ) ETF is home to many of the most powerful and dynamic companies in the US market. The ETF provides exposure to a diversified portfolio of high-quality businesses with strong financial performance and solid competitive strengths. In addition to this, the timing looks good for a position on QQQ over the middle term.
The Fundamentals
The Invesco QQQ ETF is highly concentrated. Looking at the top 5 positions in the portfolio, only 5 names account for nearly 45% of assets. Those companies are Microsoft (MSFT), Apple (AAPL), Amazon (AMZN), Facebook (FB), and Alphabet (GOOG) (GOOGL).
These five companies operate in different industries and with different competitive strategies, but they have some key characteristics in common. Names such as Microsoft, Apple, Amazon, Facebook, and Google are among the most valuable brands in the world.
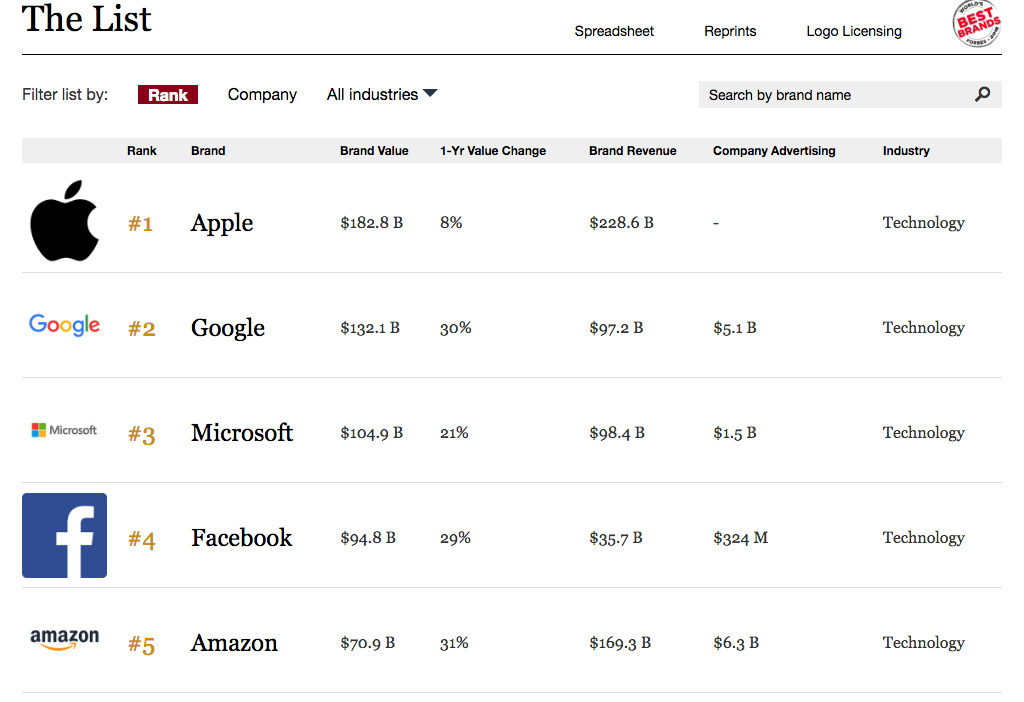
In fact, the Forbes Brand ranking considers Apple, Google, Microsoft, Facebook, and Amazon the five most valuable brands in the planet, with brand values ranging from $182.8 billion for Apple to $70.9 billion for Amazon.
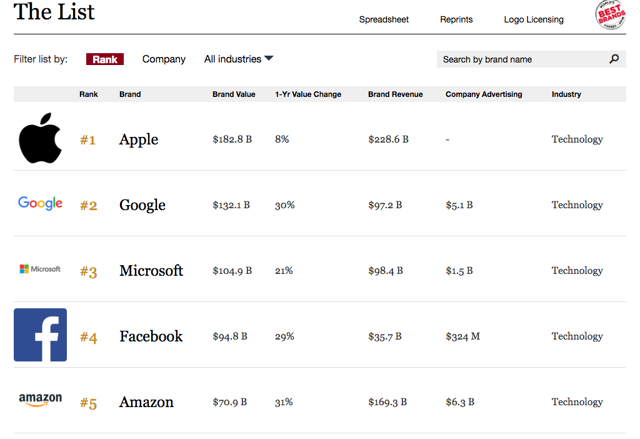
Source: Forbes
Brand value is a key source of competitive strength for companies operating in consumer-related markets. A strong brand sometimes means that consumers are willing to pay premium prices for products produced by the company versus those of the competition, which means superior profit margins for a business such as Apple.
Alternatively, a company like Amazon benefits from brand power when consumers facing different alternatives to purchase a product gravitate towards Amazon because of the company’s reputation for efficient service and reliability. This has massive implications in terms of revenue growth and market share expansion over the long term.
Industry conditions are quite dissimilar for the top 5 positions in QQQ, and this has a considerable impact on revenue growth rates. However, the five companies have delivered solid revenue growth over the past five years.
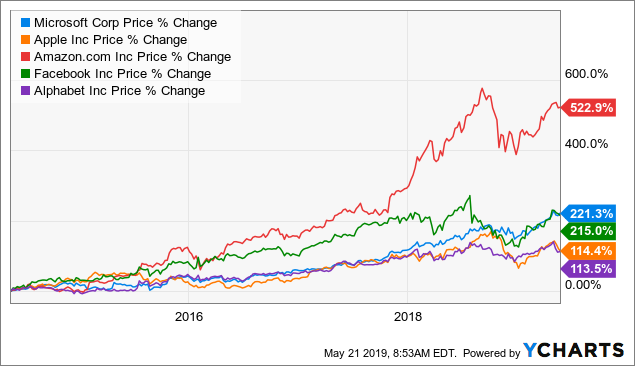 Data by YCharts
Moving beyond revenue, cash flow generation at the operating level has also been quite impressive for the top five stocks in the QQQ ETF.
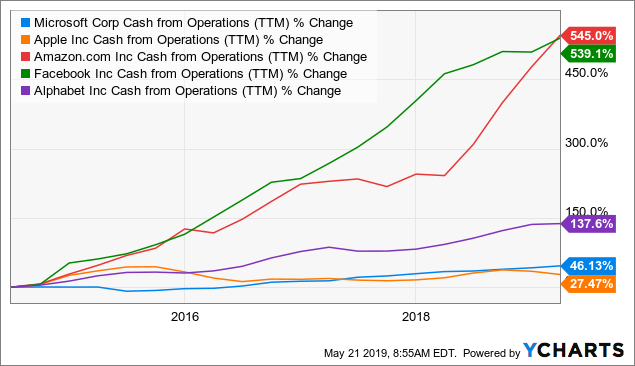 Data by YCharts
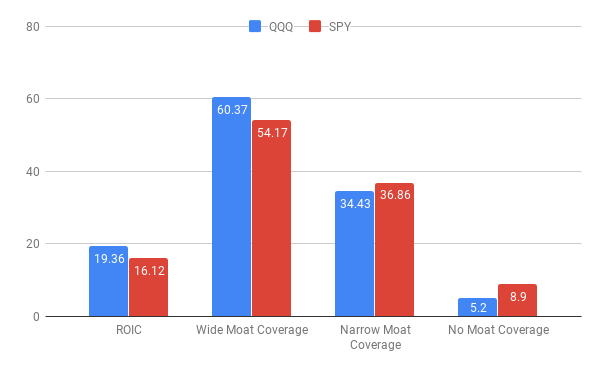
According to estimates from Morningstar, 60.37% of the QQQ portfolio can be characterized as having a wide moat (strong competitive advantages), 34.4% of the portfolio has a narrow moat (medium competitive advantages), and only 5.2% of the portfolio has no moat at all.
The average level of Return on Invested Capital (ROIC) for companies in the QQQ portfolio is 19.36%. By comparison, the average ROIC level for companies in SPDR S&P 500 (NYSEARCA:SPY) stands at 16.12%.
To put the numbers in perspective, the chart below shows the profitability data and the competitive advantages (moats) for companies in QQQ versus SPY. It’s easy to see how QQQ provides exposure to companies with superior profitability and stronger competitive advantages.
Data Source: Morningstar
Good Timing
There are two kinds of price behavior characteristics to consider when analyzing the entry price for an investment. In the middle term (meaning several months), winners tend to keep on winning and stocks in an uptrend tend to continue rising more often than not.
On a shorter timeframe, however, prices tend to exhibit mean reversion, meaning that you can expect some kind of a pullback if the price is too hot and extended in the short term.
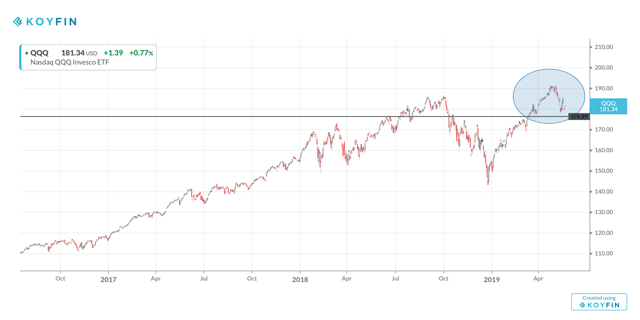
Invesco QQQ ETF made new historical highs above $190 per share in April, and then it pulled back by nearly 5% from those highs due to generalized weakness in the stock market on the back of the trade war uncertainties. In simple terms, the ETF remains in an uptrend over the long term and it has pulled back over the short term, so the timing for a position in QQQ looks quite reasonable.
Source: Koyfin.
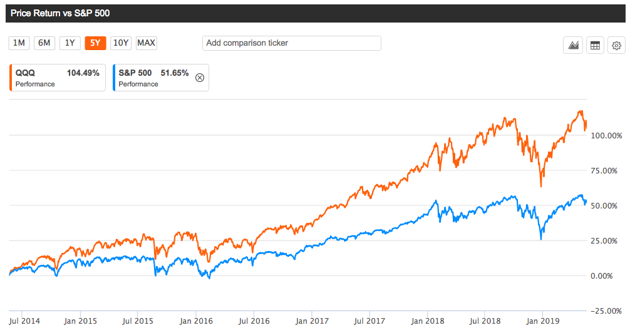
Money has an opportunity cost; when you buy an investment with subpar returns, you are missing on the opportunity to put that capital to work in alternatives with superior performance. This means that you don’t just want to buy stocks that are doing well on a standalone basis, you really need to invest in the names that are performing better than others.
QQQ does not leave much to be desired in that area, the ETF has substantially outperformed the S&P 500 index over the middle and long term.
Source: Seeking Alpha Essential
The Global Rotation System is a quantitative strategy available to members in The Data-Driven Investor. This system rotates among a wide variety of ETFs that represent different sectors based on risk-adjusted momentum.
The system is basically buying the ETFs with superior risk-adjusted returns over three and six months, so it’s basically buying strength and selling weakness, as simple as that.
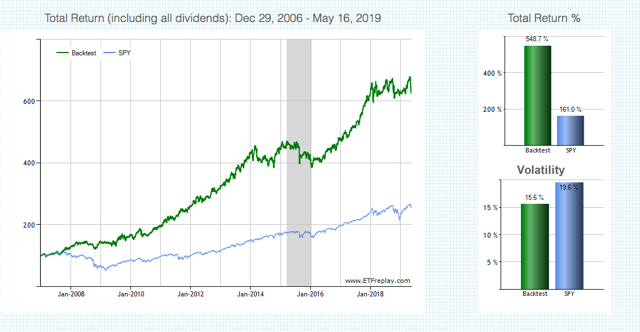
Since January of 2007, the Global Rotation System produced a cumulative gain of 548.7% versus 161% for the SPDR S&P 500 in the same period. In annual terms, the system gained 16.3% versus 8.1% for the SPDR S&P 500.
Source: ETFreplay
The system substantially outperformed the SPDR S&P 500 in terms of downside risk too. The maximum drawdown was 18.4% for the Global Rotation System versus 55.2% for the SPDR S&P 500 in the same period. Drawdown is calculated as the greatest percentage drop from the high.

Source: ETFreplay
This strategy cannot be expected to do well in each and every year, and momentum is a double-edged sword, meaning that the sectors that are delivering superior returns on the way up can many times suffer the biggest losses when markets turn around. However, the data shows that following the main trends in momentum can be an effective way to increase returns and control for downside risk in the market over the long term.
As of the most recent update, the quantitative strategy is recommending positions in technology, software, and semiconductors. The technology sector accounts for 42% of the QQQ portfolio, while the software and semiconductors industries represent 15% and 10% respectively. In simple terms, the momentum indicators look quite bullish for QQQ in terms of sector and industry composition.
Statistical research has proven that stocks and ETFs showing certain quantitative attributes tend to outperform the market over the long term. A subscription to The Data Driven Investor provides you access to profitable screeners and live portfolios based on these effective and time-proven return drivers. Forget about opinions and speculation, investing decisions based on cold hard quantitative data can provide you superior returns with lower risk. Click here to get your free trial now.

Disclosure: I am/we are long AMZN, FB, GOOG. I wrote this article myself, and it expresses my own opinions. I am not receiving compensation for it (other than from Seeking Alpha). I have no business relationship with any company whose stock is mentioned in this article.
[ad_2]
Source link Google News

