[ad_1]
This article was first released to CEF/ETF Income Laboratory subscribers 2 weeks ago, so data may be out of date. Please check latest data before making investment decisions.
During “ETF Month“, I will focus on profiling different exchange-traded funds. Some of these will be income-focused, whereas others may not be. Additionally, I may profile some higher risk sector-specific or leveraged ETFs that I can find particularly interesting. Hence, none of the ETFs profiled this month should be automatically considered to be “buy” recommendations!
(Note: due to the delay to the start of the series, “ETF Month” will be designated as lasting throughout May)
I will also be taking ETF suggestions, so do let me know if you have any ETFs on your horizon.
What are the advantages and disadvantages of ETFs compared to CEFs?
- Most ETFs are passively managed. The advantage of this is lower fees compared to CEFs, which are actively managed. The disadvantage is that a passive fund will simply own everything in the index indiscriminately.
- ETFs will nearly always trade close to their net asset value [NAV]. The advantage of this is that one does not have to worry about premiums or discounts. The disadvantage is that one does not have the opportunity to buy funds at a discount, nor to exploit the concept of premium/discount mean reversion.
- ETFs usually do not employ a managed distribution policy; in other words, they pay out as dividends what they receive as income from their underlying investments. The advantage is that one doesn’t have to worry about an ETF overpaying from its earnings, leading to destructive ROC. The disadvantage is that ETFs are generally lower yielding than CEFs.
There are exceptions to the above, of course. Some ETFs are actively managed and will have higher fees. Illiquid ETFs may trade at significant premiums or discounts to their NAV, which demands caution when buying or selling those funds. A few ETFs use a managed distribution policy, such as Global X SuperDividend ETF (SDIV), which is profiled in the first ETF Month feature.
ETF Month #4: PIMCO Enhanced Short Maturity Active ETF (MINT)
With the end of the zero interest rate policy (“ZIRP”) era, cash is no longer trash! PIMCO Enhanced Short Maturity Active ETF (MINT) and other “ultra-low/short duration” ETFs are designed to be places where investors can park their cash and harvest a more competitive return compared to a savings account or money market fund.
Important note: To be clear, while MINT does provide daily liquidation and is managed with a capital preservation focus, it is not FDIC-insured and so should not literally be considered as “cash”.
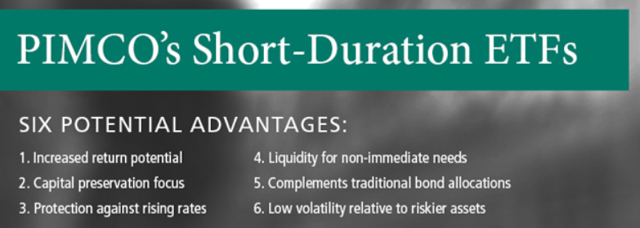
PIMCO provides the following six advantages for owning MINT:
- Increased return potential
- Capital preservation focus
- Protection against rising rates
- Liquidity for non-immediate needs
- Complements traditional bond allocations
- Low volatility relative to riskier assets
Basic details of MINT are provided below. We have previously compared MINT together with several other “cash alternative” ETFs in “Trade Alert: Adding MINT To The Tactical Income Portfolio And A Look At Some Cash Alternatives” (public link), but since we eventually went with MINT in our (since retired) Tactical Income portfolio, I’d like to focus mainly on MINT in this update article.
| Fund | MINT |
| Yield [ttm] | 2.54% |
| Expense ratio | 0.42% |
| Inception | Nov. 2009 |
| AUM | $11.75 billion |
| Avg. Volume | 949k |
| Morningstar rating | **** |
| No. holdings | 763 |
| Effective duration (yrs) | 0.27 |
| Benchmark | FTSE 3-Month Treasury Bill Index |
| SA followers | 2,374 |
Increasing popularity
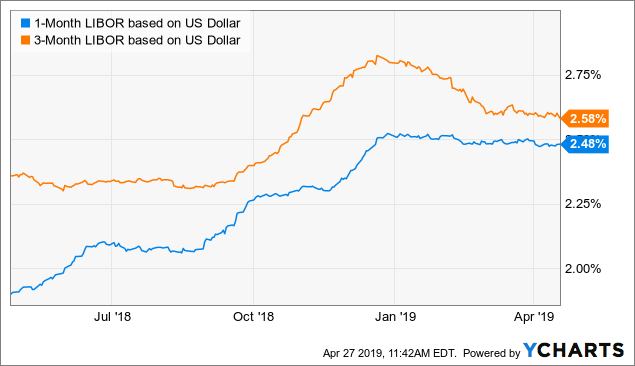
Since our last update around 1 year ago, MINT has seen increased popularity. For example, the number of Seeking Alpha followers have increased from 1,470 to 2,374. This may be partially due to the prevailing interest rates which have continued to rise during most of the past year, which also increases the yield of MINT.
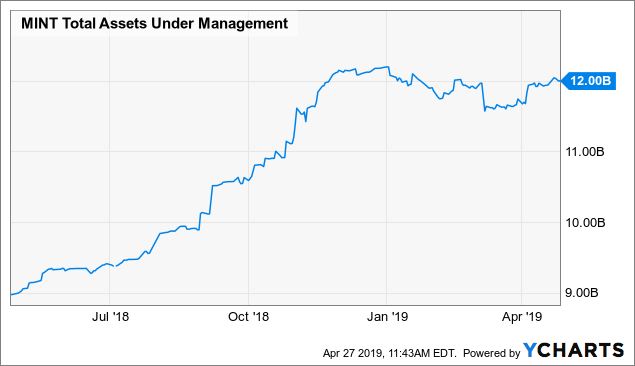
The amount of AUM has also increased substantially from around $9 billion a year ago to $12 billion today.
Portfolio
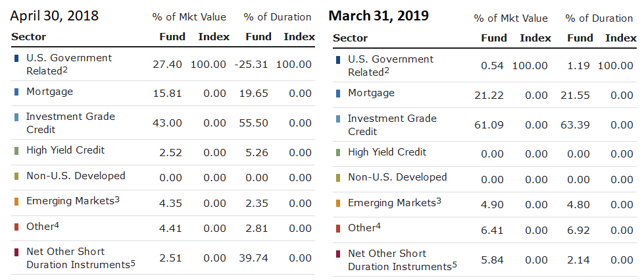
MINT has seen quite a large shift in its portfolio compared to a year ago. The biggest change is in U.S. government related securities, which have fallen from 27.40% last year to 0.54% today. Most of this has gone into investment grade credit, which increased from 43.00% to 61.09%, and mortgages, which went up from 15.81% to 21.22%. There are also small allocations to emerging markets, “other” and “net other short duration instruments”.
(Source: PIMCO)
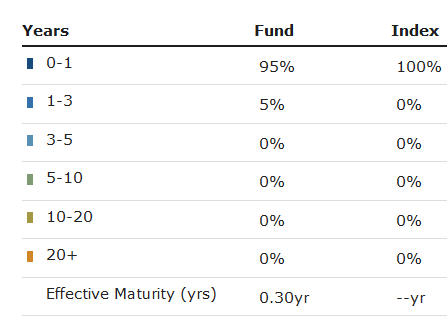
PIMCO currently reports a duration of 0.27 years for MINT, a decrease compared to last year’s 0.57 years. This should make the ETF more attractive for investors who wish for the ultimate protection against rising rates. The maturity distribution indicates that 95% of the assets of the fund matures in the next year, while 5% matures 1-3 years from now.
(Source: PIMCO)
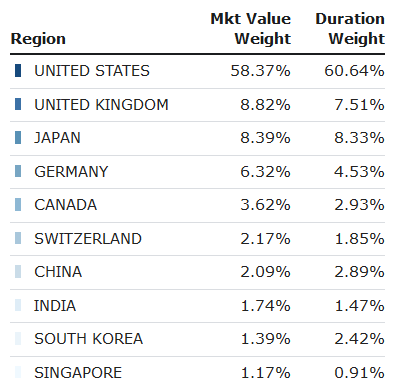
The below shows the top 10 geographic allocations for MINT, led by the United States (58.37%), the United Kingdom (8.82%), Japan (8.39%), Germany (6.32%), and Canada (3.62%).
(Source: PIMCO)
Here’s the credit rating breakdown for the fund. All of the rated debt is investment grade. However, there is also a 7.18% allocation to unrated debt. Also note that there is quite a sizable proportion of the fund (35.11%) allocated to BBB class securities, the lower rung of the investment grade ladder. Should a severe credit dislocation event occur, the fund may experience stress in some of its lower quality holdings, and thereby fail to maintain its capital preservation objective.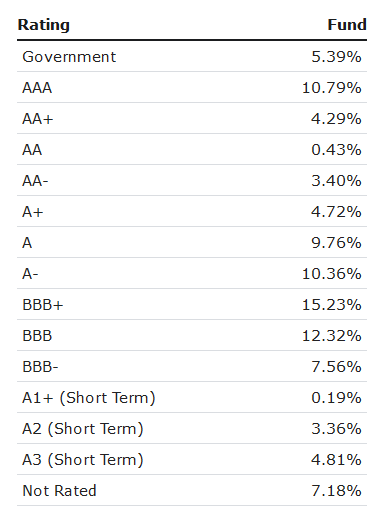
(Source: PIMCO)
Here are the top 10 individual exposures for MINT.
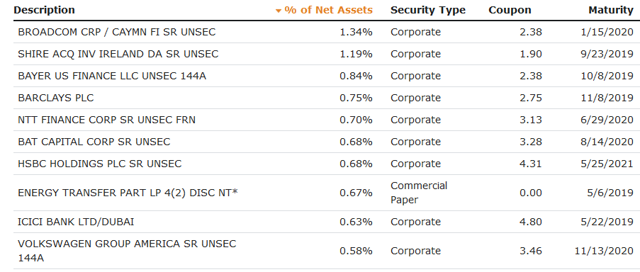
(Source: PIMCO)
Distributions
As prevailing interest rates rise, the dividend for MINT continues to rise as well. The 2.54% ttm yield is the highest since inception of the fund.
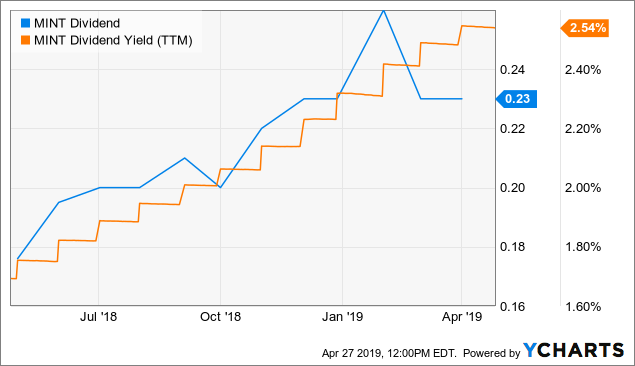
The following chart shows the monthly dividend and ttm yield for MINT since inception.
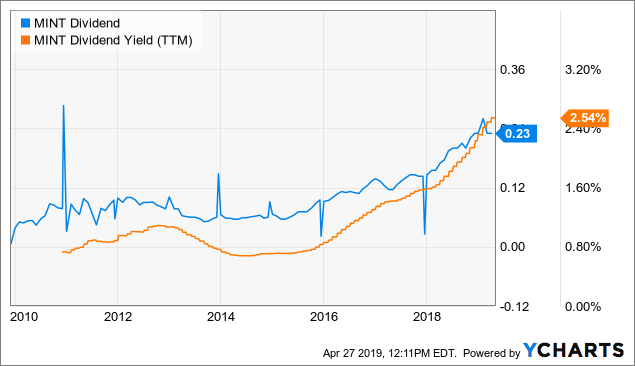
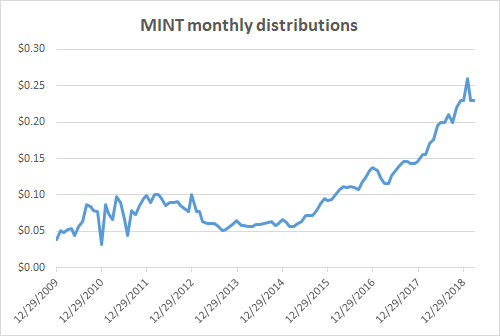
The apparent “spikes” in the chart above are due to special dividends from MINT. I’ve removed the special distributions from the chart below, so you can see a smoother trend in the payouts.
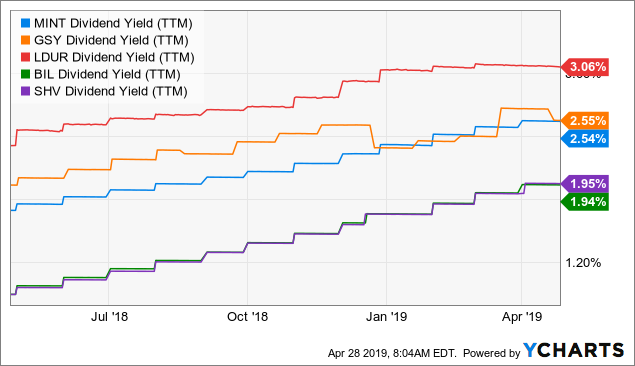
The 2.54% ttm yield of MINT is competitive with other short/ultrashort duration ETFs on the market, such as Invesco Ultra Short Duration ETF (GSY), PIMCO Enhanced Low Duration Active ETF (LDUR), SPDR Barclays 1-3 Month T-Bill ETF (BIL), and iShares Short Treasury Bond ETF (SHV). LDUR, also a PIMCO ETF, offers the highest ttm yield of 3.06%, but note that it takes on higher duration risk than MINT, with an effective duration of 1.30 years. We may take a closer look at LDUR in a future article.
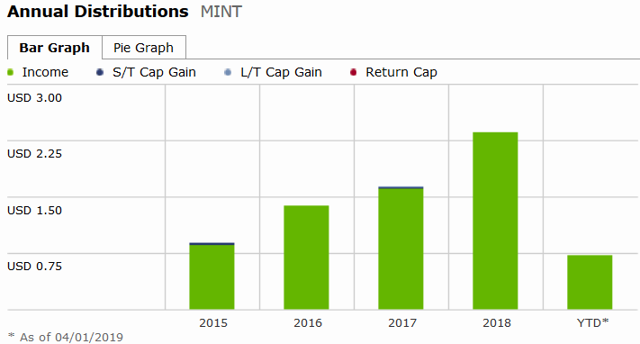
Note that the distributions from MINT are classed nearly entirely as income, as expected.
(Source: Morningstar)
Performance
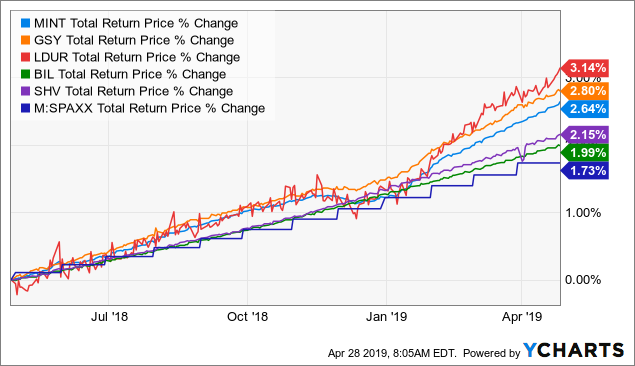
Over the past 1 year, MINT has returned +2.64% in total return, falling in about the middle of the pack (the above five ETFs plus Fidelity Government Money Market Fund (SPAXX), a very popular money market mutual fund). The best performing fund was LDUR at +3.14% return.
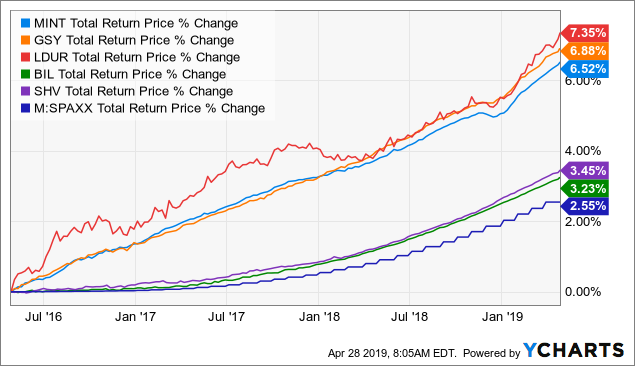
Stretching back the time period to three years shows the three active ETFs (MINT, GSY, and LDUR) clearly separating themselves from the three passive funds (SHV, SHY, SPAXX), with most of the outperformance coming in the first two years. Why is this? My guess is that when treasury/money market rates were still very low in 2016 and 2017, the active ETFs could invest in different kinds of paper (such as corporate debt) while maintaining their low duration and capital preservation mandates. However, with treasury/money rates now comfortably at the ~2% level, the active managers are finding it more difficult to sustainably outperform that without taking on too much credit, duration or other kinds of risk.
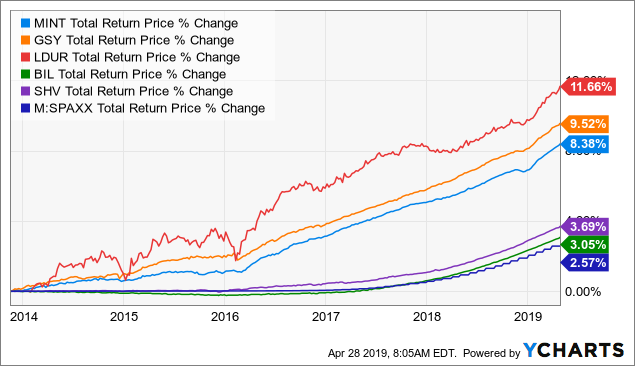
Since January 2014 (inception of the newest fund, LDUR), LDUR is the clear winner at +10.44%, while MINT (+7.97%) is the worst out of the three active ETFs. GSY is second at +8.88%. The three passive ETFs trail far behind.
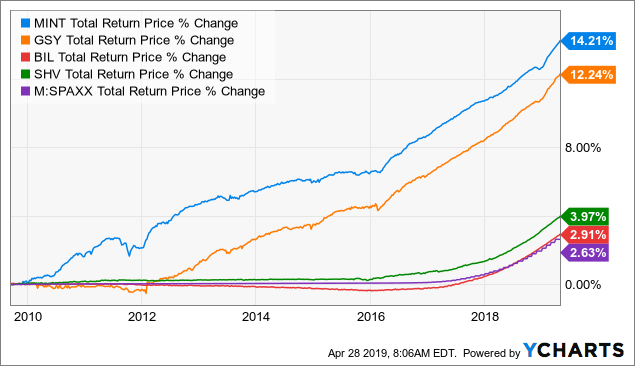
Removing LDUR allows the time frame to be stretched back to December 2009. Here, MINT (+14.21%) outperforms GSY (+12.24%). The 1-3 treasury bond ETF, SHY, does quite well at +9.17%.
Let’s take another look at the 1-year chart, but with price-only returns (without the effect of distributions). This way, we can analyze the behavior of the funds during last December’s mini-credit panic more clearly. SPAXX has been removed since it always trades at an NAV of $1.00.
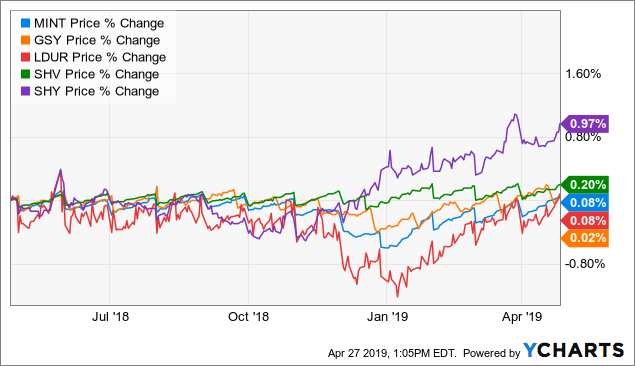
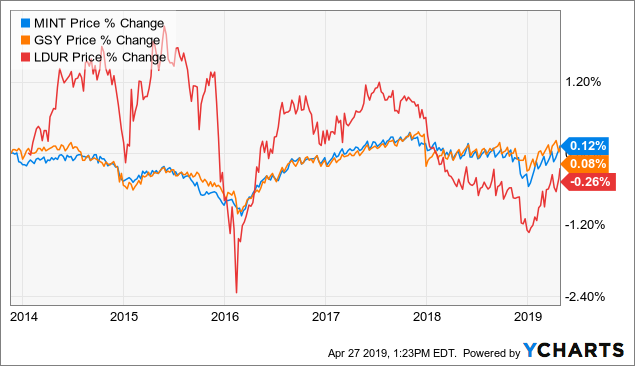
The chart above shows that LDUR experienced the most significant drawdown of around -1.20% during the correction. MINT fell by around -0.50%, while GSY fared comparatively the best at -0.30%. Interestingly, we have a divergence with the two treasury ETFs, SHV and SHY, actually gaining in value during that period, suggesting a “flight to safety” to the highest quality assets only.
The ETFs did not suffer significant dislocations in premium/discount during the correction, meaning that their price declines were actually due to a fall in the NAV of their underlying portfolio rather than a sudden failure of ETF arbitrage mechanisms.
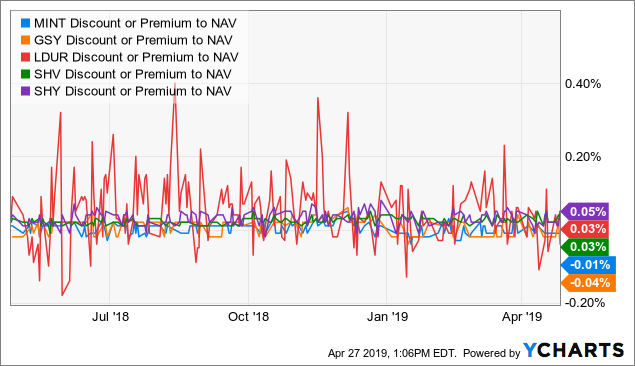
The above does suggest that if we were to encounter another 2007-2008 type scenario, that actively-managed short/ultra-short duration ETFs (and the PIMCO ETFs in particular) might not succeed in achieving their objective of capital preservation. Hence, I stress again that MINT should not be considered as a literal “cash alternative” like money in a savings account.
Here’s the price-only chart of only the three actively managed short duration ETFs since January 2014. We can see that LDUR is unlike the other two funds in that it shows a much higher price volatility (although its returns have also been the highest). Therefore, MINT and GSY are closer peers to each other and also closer to being considered as a “cash alternative” compared to LDUR.
Summary
Cash is no longer trash! One unexpected (at least to me) consequence of this is to find that as short-duration treasury/money market rates have risen, the ability of actively-managed short/ultrashort duration ETFs such as MINT to outperform the safest investments has commensurately diminished. In other words, over the past year, it has been less beneficial to put money in MINT versus a short-duration treasury (e.g. SHV)/money market fund (e.g. SPAXX) than it has been in previous years.
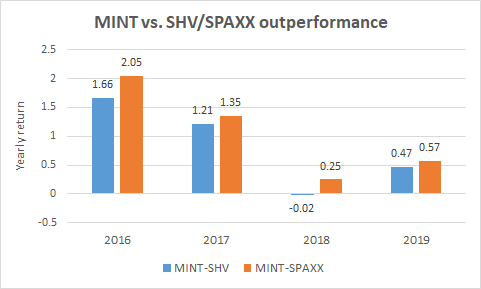
This can be mostly attributed to the diminishing spread between the yields of MINT and the short-term treasury/money market funds, as alluded to above. The below chart shows the spread between MINT’s dividend yield and that for SHV and SPAXX over the past several years.
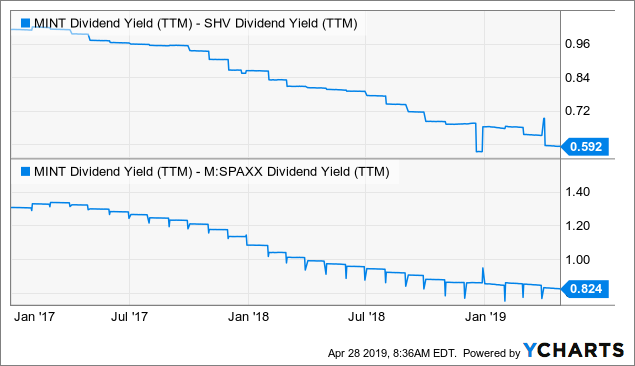
Meanwhile, investors are still being exposed to the risk of owning less than the highest-quality paper in MINT or other short/ultrashort duration ETFs, and this drawback was seen in full display during last year’s correction. While the drawdowns were only limited to -1.20% for the worst ETF, LDUR, and around -0.50% for MINT, in a GFC-type situation, the damage could potentially be considerably worse. Hence, investors should be reminded again that MINT should not be considered as truly “cash”.
In summary, I think MINT is still a decent parking spot for investors with really nothing better to do with their cash or for those who are waiting for better buying opportunities to emerge. While not totally safe, MINT is still pretty safe in all but the most severe of credit crises. And, a 2.54% yield is still marginally better than the best savings accounts rates (which are FDIC-insured) you can get across all of the country right now. However, as I noted above, the comparative advantage of MINT versus the safest investments has diminished.
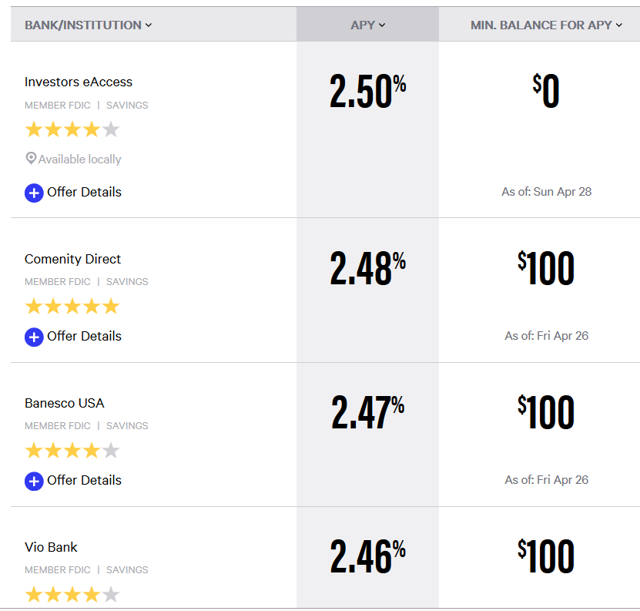
(Source: Bankrate)
We’re currently offering a limited time only free trial for the CEF/ETF Income Laboratory with a 20% discount for first-time subscribers. Members receive an early look at all public content together with exclusive and actionable commentary on specific funds. We also offer managed closed-end fund (CEF) and exchange-traded fund (ETF) portfolios targeting ~8% yield. Also, check out our 5-star member reviews.
SIGN UP FOR A FREE TRIAL AND 20% DISCOUNT OFFER HERE.
Disclosure: I/we have no positions in any stocks mentioned, and no plans to initiate any positions within the next 72 hours. I wrote this article myself, and it expresses my own opinions. I am not receiving compensation for it (other than from Seeking Alpha). I have no business relationship with any company whose stock is mentioned in this article.
[ad_2]
Source link Google News

