[ad_1]
Yesterday, I wrote a piece, in which I made the argument that we are likely to see a temporary top in the rally in crude oil. It is my belief that while this top is temporary, the market statistics strongly indicate that there is a tradable opportunity which nimble investors can capitalize on in the coming months. Specifically, I believe that the United States 3x Oil Short Fund (NYSEARCA:USOD) from USCF Investments makes for an excellent buy over the next 1-3 months. Let’s jump into the thesis.
Bullish Variables
The primary reason which I believe that buying USOD makes for a good trade is the market statistics surrounding the price movements of WTI over the last several months. The first market variable we’ll examine is the persistency of the current trend in WTI.
A useful way of measuring the existence of a trend is taking a moving average of price. When price is above the moving average, it can be considered to be trending upwards. When it is below a moving average, it can be considered to be trending downwards. When choosing a length of a moving average to analyze, I prefer something simple and logical rather than playing an esoteric optimization game. In the case of WTI futures, I use a four-week moving average of price compared to the weekly price data. In other words, the price of WTI versus its one-month average.
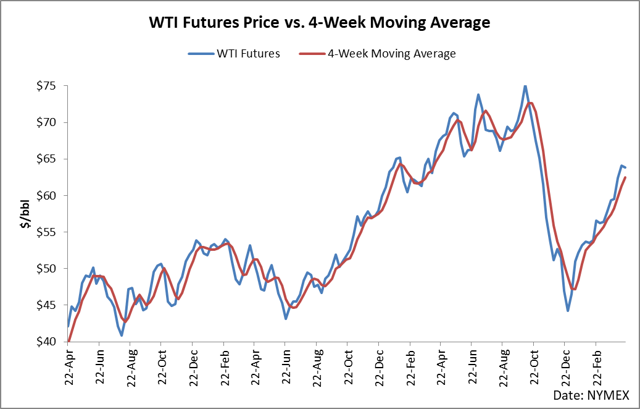
When we examine a moving average, we can quantify useful statistics which can give actionable information and predictive edges in seeking to understand future price movements. As discussed yesterday, a metric I’ve found useful is quantifying how long price has stayed on one side of the average. This informs the analyst as to how persistent and consistent a trend has been. As seen in this chart, before this current week, we have had 15 end-of-week prints settle above the one-month moving average.
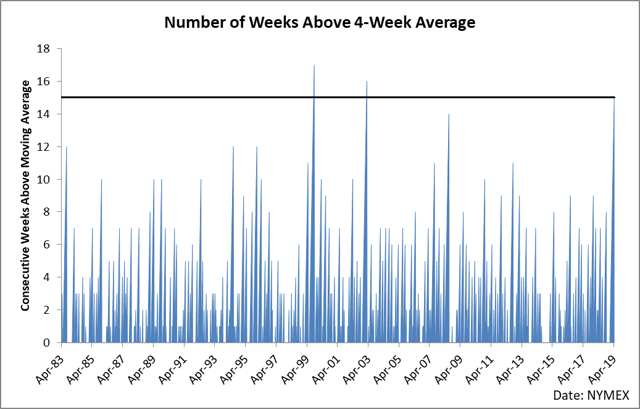
In the history of WTI futures, we have only had two periods of time in which the trend continued beyond this point. And in each of these situations, the trend ended within two weeks by price falling back below the moving average. The mechanics of a moving average means that it will always follow price, so it requires price to fall in relation to history for price to close below the moving average.
As I showed yesterday, there is a direct correlation between future price returns and how many weeks WTI has stayed in a rally above the moving average.
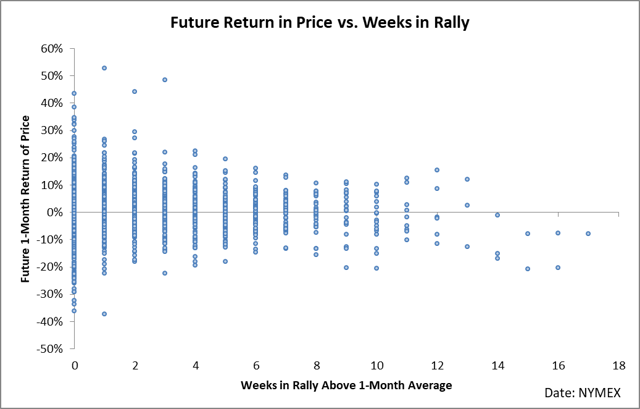
In the history of WTI, we have never seen a rally which lasted longer than 13 weeks in which price did not fall over the next month. On average, these price declines were anywhere from 10% to 20% from the observation point. In other words, if the current situation follows how history has generally played out, we are probably going to see WTI fall by 10% or more over the next month simply based on market sentiment.
What’s more, the recent price extension above the moving average shows just how far the rubber band is stretched. Here is a chart of the future price movements of WTI versus the distance above the one-month moving average that price was for all periods of time, in which the price has trended 10 or more weeks.
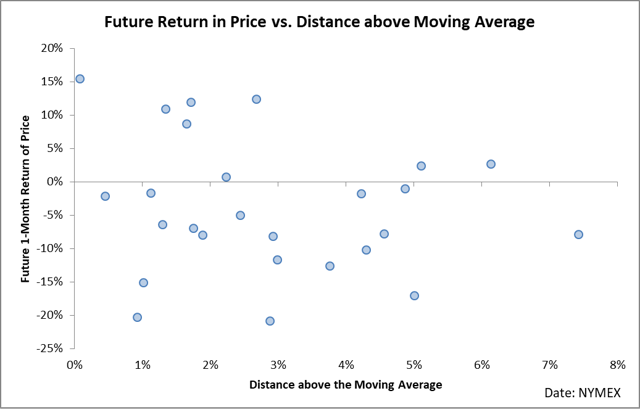
This week has been a bit volatile, but over the last 2-3 weeks, we have settled in the territory of 2.2-4.5% above the moving average on a weekly basis. This territory historically sees price declines of anywhere from 5% to 20% over the next month with very few occasions in which the trend continued.
From a statistical standpoint, the case is pretty clear. The rubber band is stretched too far to the upside in WTI futures, and the current trend is statistically unsustainable. Of course, statistics can be wrong, and price can continue its trend, but if we continue much longer, we will be in the longest consistent trend in the history of WTI. In fact, if we were to play around with the moving average and shorten it to three weeks, we are in the most extended trend in history.
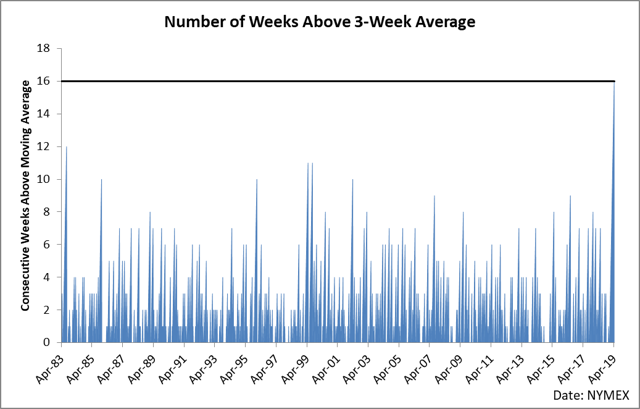
I’m wary of varying parameters too much in that it’s just a funny form of optimization and you can make the data say whatever you want, but I show this just to give some perspective that things truly are stretched to the upside by a substantial margin.
There is another very substantial bullish factor to consider when it comes to buying USOD, but this time, it is something much more instrument-specific than the previous factor. When it comes to USOD, its prospectus is quite revealing. USOD is basically a 3X inverse version of USO, and USO suffers massively from roll yield. As I’ve pointed out before, USO has historically been demolished from roll yield – in some cases, underperforming its underlying benchmark by up to 47% in a given year.
Roll yield sounds complicated, but it’s actually pretty straightforward. Futures markets tend to converge towards the front contract as time goes on. When the market is in backwardation (front months over back months), then back contracts tend to rise on a relative basis. When the market is in contango (front months under back months), then back contracts tend to fall on a relative basis. How this plays out is that in a given day if WTI rises say 3% in the front month, then the next month out will probably rise something like 2.9% and so on.
For holders of USOD, this is where the thesis gets interesting. The market is currently in contango despite a recent flirt with backwardation. And USOD follows a similar roll yield process of USO (which is regularly crushed by roll yield). Since USOD actively rolls a position inverse and leveraged to USO’s position, USOD is poised for substantial gains from rolling. Mechanically, USOD is short futures in the prompt, and during roll, it will be moving that short position to a higher priced contract which will depreciate in value in relation to the front of the curve, thus grinding out a slow but consistent gain as long as the market remains in backwardation.
These two factors: a stretched flat price and favorable roll yield strongly suggest that USOD is a favorable trade in the immediate future.
Bearish Factors
To temper our expectations, we also need a quick look at two bearish factors against our USOD trade. The first of which is the undeniably bullish fundamental picture.
Article length prevents me from stepping through all of the fundamentals (see here for a full dive), but it basically boils down to this. Crude inventories are weak versus historic averages, and we’re entering into a season in which demand increases. Not only is demand poised to rise, but it’s also starting from a weak place in that product stocks (gasoline and distillate) are weak already, which means we’ll likely have greater demand than normal during the summer driving season. This is a long-term structural bullish picture for the underlying commodity at least through the end of summer.
Another bearish factor is the nature of leveraged ETFs. If you read this thesis and decide to buy USOD over a long period of time, please don’t. Leveraged ETFs are crushed over long periods of time in general due to the simple mathematics of volatility and prices. Basically because a 1% drop requires more than a 1% gain to recover, during periods of sideways, volatility leveraged instruments are crushed. If an instrument trades sideways without really going anywhere for a long period of time and you’re multiplying the daily moves by 3, you’re probably going to see the value of your leveraged instrument collapse substantially over that period depending on the path of returns. This is one of the reasons why leveraged instruments seem to lose more often than not. To read more about this, see here.
Putting it All Together
It is my belief that USOD makes for an excellent trade over the next 1-3 months based on market statistics and a favorable roll yield. I believe these variables will propel WTI’s price lower, and we could potentially see a rally of 3x that of historic movements. For example, in the past, similar environments have resulted in WTI falling by 10-20% over the next month. It is possible that we will see this happen again – and USOD will potentially see up to 3 times this movement to the upside. However, we need to hasten to add that this is a trade against the fundamentals, and over lengthy periods of time, leveraged instruments can experience decreases in value due to the mathematics of daily return multiplication. In other words, proceed – but with caution.
Disclosure: I/we have no positions in any stocks mentioned, and no plans to initiate any positions within the next 72 hours. I wrote this article myself, and it expresses my own opinions. I am not receiving compensation for it (other than from Seeking Alpha). I have no business relationship with any company whose stock is mentioned in this article.
[ad_2]
Source link Google News

