[ad_1]
Note: The intent of the “ETFs in Focus” list is to highlight ETFs that I feel are short-term trade opportunities. As such, these ideas may be more appropriate for those investors looking to be more active traders in their portfolios, but could also fit into a long-term buy-and-hold strategy. This was originally released to ETF Focus subscribers approximately 2-3 weeks ago.
Let’s take a look ahead at the ETFs to watch over the next few weeks!
The Equity ETF Idea
I’ve talked a lot over the last few months about tilting your portfolio towards quality companies. With economic growth starting to slow down all around the world (although data is more mixed here in the United States), it’s prudent to think about focusing on companies that are backed by strong fundamentals and balance sheets to help weather some of the downside that could come with a more recessionary environment.
There’s no one universal definition for quality so there are a number of ways that you could go about identifying “quality” companies. If you want a straightforward ETF that uses a variety of metrics to measure quality, you might go with the iShares Edge MSCI USA Quality Factor ETF (QUAL). It looks for combinations of high return on equity, low earnings variability and low leverage in its selection process. While it tends to score highest for quality, it also trades at around 20 times trailing earnings which isn’t terribly cheap. The Pacer U.S. Cash Cows 100 ETF (COWZ) invests in companies that generate a lot of excess cash. These businesses tend to demonstrate both financial strength and flexibility and uses a strategy that historically has delivered above average returns. There are also funds, such as the FlexShares Quality Dividend Index ETF (QDF), which use a quantitative selection method to combine quality companies with high yields.
Any one of those ETFs would make a solid addition to either the core of your portfolio or as a satellite position to tilt towards quality or yield. My preferred choice at the moment though is the WisdomTree U.S. Total Earnings ETF (EXT). As the name suggests, it weights its portfolio by total earnings generated over the previous four quarters instead of market cap.
This strategy gives the fund a couple of advantages. The first is relative value. Whereas the S&P 500 trades at roughly 17 times next year’s earnings, EXT has a P/E ratio of just 14 which should give the portfolio a degree of downside protection should the market pull back again. The P/B and P/CF ratios for EXT are also about 15-20% lower than the broader market.
The second is its low volatility characteristics. If you look at the factor box for EXT, it actually scores quite well for value, quality, yield and low volatility.
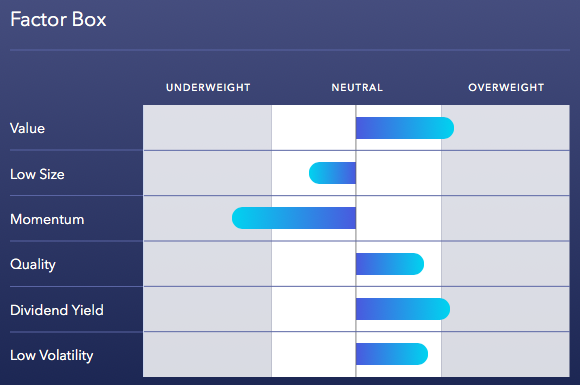 The fact that it’s underweight to the low size factor isn’t surprising given that 85% of the portfolio is in large-caps. The lack of momentum also isn’t surprising. Momentum strategies have focused mostly on tech and healthcare over the past year or two. EXT is significantly underweight to healthcare and overweight to financials, one area of the market that momentum hasn’t really touched.
While the overweight to financials may not be ideal given the current low rate, low inflation environment, the portfolio as a whole is filled with the biggest, most profitable companies in the United States. It’s cheap, it’s less volatile and could be a good candidate if you want to tweak your core equity exposure.
Recommendation: Accumulate
One thing to watch for on EXT is liquidity. It only trades about 10,000-20,000 shares daily so trading could be a little choppy. You could also substitute the WisdomTree U.S. Earnings 500 ETF (EPS) for EXT. It focuses on just the large-cap segment of the market but trades more frequently.
The Fixed Income ETF Idea
The outlook for the fixed income market has changed quite a bit over the past several months. Heading into the second half of 2018, it looked like the Fed was going to continue raising rates and the yield curve was slowly going to at least move higher if it wasn’t going to steepen. That type of market generally spells trouble for funds with interest rate risk exposure since higher rates mean lower bond prices. This is why I spent a good chunk of last year recommending the iShares Floating Rate Bond ETF (FLOT). The floating rate aspect of these bonds means they carry very little interest rate risk and the quarterly reset of rates means they can respond quickly to changes in the rate environment.
Since then, the Fed has modified its stance and now projects virtually zero rate hikes for the foreseeable future. In fact, the Fed Funds futures market says there’s roughly a one-in-three chance we’ll see a rate cut before the end of the year. The yield on the 10-year Treasury note has dipped from a high of 3.24% in November to just 2.60% today. That’s been good news for anyone who’s held fixed-rate bonds since then, but not so much for holders of floaters. Since the beginning of November, the iShares 20+ Year Treasury Bond ETF (TLT) has gained 9.5%, while FLOT has returned a scant 0.9%.
Holding FLOT hasn’t done much for shareholders over the past six months, but how does it look from this point going forward? If you look at the direction of rates currently, the Fed’s interest rate forecast and expectations for a continuing global economic slowdown, there’s not much reason to expect that rates are going to rise from here. And if they do it almost certainly won’t be a big move. On the other hand, rates could still very well head lower. The flat curve suggests that investors are skeptical about future growth prospects and a prolonged trade war with China to could send investors fleeing to the safety of bonds in large numbers.
If that’s the case, fixed-rate bonds should continue to do well, but I wouldn’t abandon floating-rate notes just yet. FLOT offers a yield of 3.1% right now with very little interest rate or credit risk. You’d have to venture out into 30-year Treasuries to find a yield like that. Plus, if safety is your thing, FLOT is probably a better option than anything outside of T-bills. The iShares Short Treasury Bond ETF (SHV) currently yields about 0.7% less than FLOT, so you can see how FLOT strikes a nice balance between yield and safety.
Recommendation: Hold
If rates continue falling, FLOT will very likely be a below average performer, but falling rates are far from a sure thing. I reiterate my position that junk bonds should be avoided despite gaining more than 7% year-to-date. If you’re betting on falling interest rates, a Treasury or investment-grade corporate bond ETF is probably the play. If you’re more concerned about safety in an uncertain economic environment, FLOT is still worth owning.
The International ETF Idea
Despite all of its lingering issues, such as the impact of tariffs and slowing GDP growth, China has still been one of the top performing countries of 2019. When I made the iShares MSCI China ETF (MCHI) one of my top picks at the beginning of the year, I noted:
…my MCHI pick for 2019 is based on my belief that the two countries will come to some type of trade resolution sometime in the second half of the year. There is a lot of risk in investing in China right now. The economy is slowing and the fiscal bubble could begin bursting at any time. But a firm resolution to the trade war could see Chinese stocks enjoy a 10-20% bounce.
That’s call was come mostly true. MCHI is up 16% year-to-date although it’s not due to an actual trade resolution being reached but instead to eternal optimism that a deal is near. I still believe it’s more likely than not that a trade agreement will be reached sometime in the second half of the year but negotiations have been so on-again/off-again that it’s difficult to pinpoint any more specific time frame.
Even with 2019’s rally, I still believe that China has more upside ahead for a few reasons. First, of course, is the aforementioned trade pact. The fact that China has posted strong gains even without a deal suggests that much of the upside of an agreement is probably already priced in. Still, I think there will be at least a minor bump when (if) a deal is reached but the degree will depend on what’s in the agreement itself.
I also consider the Chinese A-Share market to be a bullish indicator. MSCI recently announced that it’ll be adding more China A-Shares to its emerging markets indices in the near future. Granted, it will be just a small percentage of the total A-Share market but it’s an encouraging sign for foreign investors that this previously untapped market is finally beginning to become available to outsiders. The addition of China A-Shares to emerging markets indices means that ETFs that benchmark to them will be forced to buy in order to maintain its tracking to the index. A-Shares have already been quite popular this year as the Xtrackers Harvest CSI 300 China A-Shares ETF (ASHR) is up 25%.
Skeptics will point to slowing GDP growth as a reason to avoid adding to positions in China, but I’m not as down on it as some. The main reason being that the Chinese government always seems ready and willing to step in with fiscal stimulus if ever anything goes wrong. Add in 6% growth with a market that still trades at just 12 times forward earnings and you’ve got a country that has some motivation to continue working its way higher.
I own shares of MCHI personally, but another intriguing option is the Xtrackers MSCI All China Equity ETF (CN). Where most other China ETFs focus on just one market segment, this fund has the benefit of targeting all share classes and market-caps within the country – large- and mid-caps across China A-shares, B-shares, H-shares, Red-chips, and P-chips. MCHI is up 16% year-to-date while ASHR is up 25%. CN falls right in the middle with a 20% return since it owns pieces of both markets.
Recommendation: Buy
CN could be used to tilt the international core piece of your portfolio towards more emerging markets exposure. Or it could be used as a pure sector/thematic play with a small percentage of assets. Either way, I think there’s more potential in China right now and investors should be considering an overweight to the country.
The Dividend ETF Idea
If you’re a yield seeker, you’ve probably come across the Global X SuperDividend ETF (SDIV) at one time or another. It’s typically one of the highest yielding ETFs available because it’s strategy is simple. It invests the 100 highest yielding securities available (after eliminating a few unsustainably high yielding stocks). Currently, it offers a yield of 9.3%, one of the highest levels it’s been at since its inception in 2011.
But before you see the yield and immediately decide to jump in, it’s important to understand how the portfolio is constructed and why it might not be so palatable.
There are two things you need to know about SDIV. First, it’s very concentrated. Any fund that targets the highest yielding securities is going to find a lot of them in the same market sector. In this case, it’s real estate. More than 50% of SDIV’s assets are invested in REITs which tends to make it volatile and rate-sensitive.
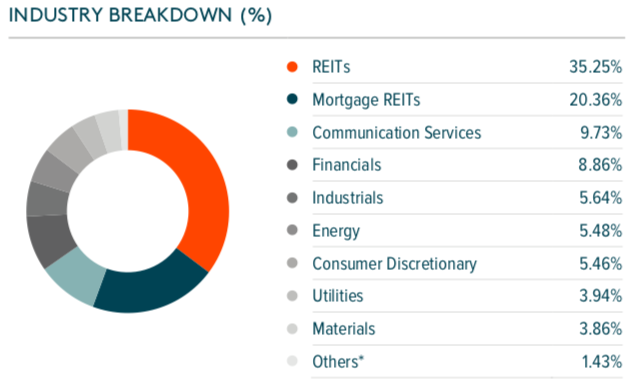 Real estate has had a nice run lately but that’s a lot of eggs to put in one basket. The high exposure to real estate hasn’t even translated to above average returns lately for SDIV. The mortgage REIT group has underperformed the sector in general and the 46% non-U.S. exposure has also been a drag.
Even a bigger negative than that is that SDIV isn’t generating enough income to support the dividend. According to a piece that Stanford Chemist recently ran on his site, approximately 88% of the dividend is currently covered. That’s higher than it’s been in recent years, but it’s still well below the 100% mark. SDIV has maintained an essentially fixed monthly payout structure for about the past six years. It had been paying just over $0.12 per share monthly since 2013 before upping it to $0.135 in the middle of 2018. Since the portfolio is not generating the income to support the dividend, it has to make up the difference with a return of capital. In many cases, that ROC erodes the fund’s NAV and shows up in the fund’s total return.
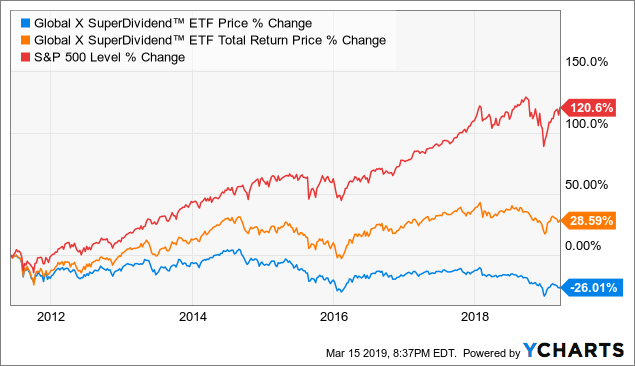
You can see how this plays out in SDIV’s historical returns. While the fund has returned nearly 30% since inception, its share price has dropped by 26%.
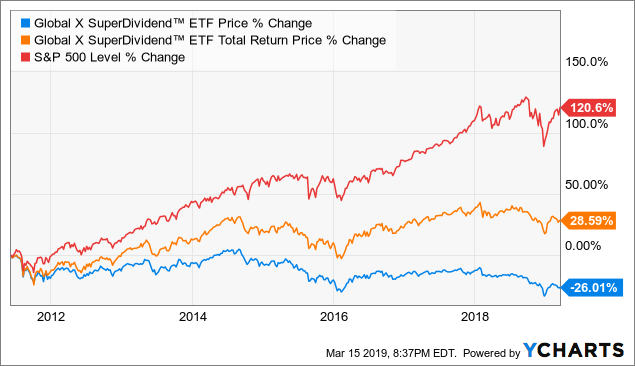
You can also see that SDIV has had a really rough time staying even in the same zip code as the S&P 500. That’s not entirely a fair comparison since SDIV is half invested overseas, but the comparison against its peer group average isn’t much better. It earns just a 2-star rating from Morningstar and trails Morningstar’s World Small/Mid Stock category average return by nearly 3.5% per year.
Recommendation: Avoid
If you’re a big believer in the real estate sector or are interested in generating a predictable monthly income from your portfolio, I can understand committing a small percentage of assets to SDIV to go for the yield boost. Beyond that though, I wouldn’t recommend building a significant position in SDIV. The total return history has been poor and the lack of dividend coverage puts it at risk of a dividend cut at some point in the future.
The Smart Beta ETF Idea
Another one of my picks at the beginning of the year was the biotech sector. I believed that a healthy backdrop for the healthcare sector in general combined with what had the potential to be an active M&A environment could power the sector to strong gains (Spark Therapeutics (ONCE) being a prime example). I went with the equal-weighted SPDR S&P Biotech ETF (XBI) over the more top-heavy iShares Nasdaq Biotechnology ETF (IBB) in order to both spread out risk and take advantage of heavier weights to some of the sector’s buyout candidates. That proved to be the right call as big names Amgen (AMGN), Gilead (GILD) and Biogen (BIIB) have all underperformed.
But even I didn’t expect the sector to rise so far so fast. XBI has gained 27% year-to-date and is one of the top 20 best performing non-leveraged equity ETFs in 2019. This has been very nearly a best case scenario but I’ve begun asking myself if it’s time to take a few chips off the table.
The big biotech boom of several years ago gave us a peek at both the upside and downside of this group. From the beginning of 2012 to its peak in July 2015, XBI gained more than 300%. Within seven months, XBI dropped 50% in value and effectively wiping out the vast majority of the gains that it had built up over the previous few years. I don’t get the sense that the biotech sector is setting up for another boom/bust cycle like that again but it’s worth being cautious given its recent run.
From a fundamental standpoint, the sector still looks pretty attractive. It still trades at 15 times forward earnings although other metrics aren’t quite as kind. XBI traded at $100 as recently as six months ago so it’s kind of hard to say that the group as a whole is terribly overvalued.
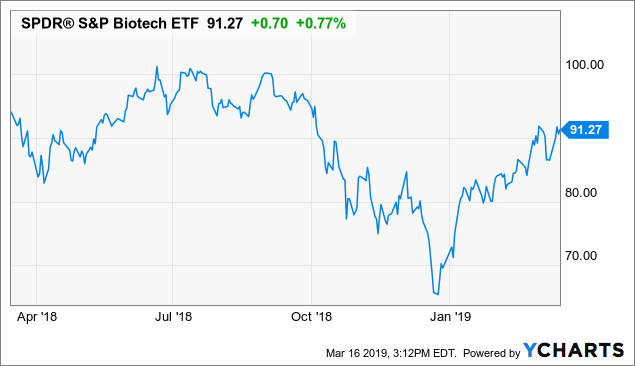
I think the overall backdrop for the biotech group looks positive but I’d be tempted to trim my holdings a bit here and sell high.
Recommendation: Hold or Slightly Reduce
I wouldn’t make any significant reduction to my biotech position but I think selling about 10% seems prudent in order to lock in some profits. I certainly wouldn’t abandon biotech and think there’s still upside remaining but I’d recommend a focus on capital preservation here as well.
The Brand New ETF Idea
A lot of ETF industry watchers talk about environmental, social and governance focused investing as the next great trend. So far, however, it’s barely registered on the radar. It seemed that when Vanguard launched both the Vanguard ESG U.S. Stock ETF (ESGV) and the Vanguard ESG International Stock ETF (VSGX) that interest in the space would increase. Alas, the pair has managed to gain less than $300 million, low by Vanguard standards.
The tide may have shifted a bit this week with the launch of the Xtrackers MSCI USA ESG Leaders Equity ETF (USSG). Just a couple of weeks following its launch, it’s amassed nearly $900 million in assets already making it one of the largest socially conscious ETFs in the marketplace. Why has USSG succeeded where others have failed? Fees are a big factor. At just 0.10%, it’s undercut the competition on cost.
Getting into specifics for a moment, USSG starts with a broad universe of large- and mid-cap companies and then overlays MSCI ESG Ratings, MSCI ESG Controversies and MSCI Business Involvement Screening Research to determine its index’s components. In the end, the portfolio doesn’t look all that different from a broad large-cap fund except for the fact that giants, such as Apple (AAPL), Amazon (AMZN) and Facebook (FB) are nowhere to be found.
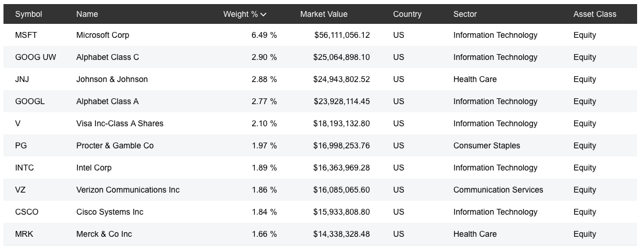 From a sector standpoint, weightings to most sectors within USSG aren’t all that different from what you find in the S&P 500, so it’s not unreasonable to think that you could slide this in to the core of your portfolio if you want to put a socially responsible spin to it.
Recommendation: Wait and see
While it wouldn’t be the cheapest fund in the portfolio, USSG and its 0.10% expense ratio is cheap enough that it could be a replacement for the Vanguard Mega Cap ETF (MGC) in Ultra Low Cost Core. Same concept applies to Core Conservative Growth where USSG could slide into the Vanguard Total Stock Market ETF’s (VTI) place. This fund may be more appropriate if you’re looking to eliminate some of the more morally onerous companies from your portfolio, but the broad diversification and ultra-cheap expense ratio means that USSG could be a contender for inclusion in many portfolios.
Low liquidity and high trading costs usually mean that brand new ETFs aren’t immediate options for our model portfolios, but the fact that USSG is already approaching the $1 billion mark and trading spreads have already come way down means that this fund may be the exception to the rule. I’m still rating this a “wait and see” given that it’s less than two weeks old, but I think this ETF will be investable pretty soon.
The Bonus ETF Idea
Brexit has been all over the news and anyone who tells you they know how this whole thing will turn out probably doesn’t. I came across this graphic from J.P. Morgan trying to put odds down on what will happen next but there’s no real consensus.
 I won’t dive into how Brexit may resolve itself here other than to say that there’s a lot of uncertainty still hanging over the whole nation and its financial markets. While sentiment weighs on the country, the iShares MSCI United Kingdom ETF (EWU) has managed to post a gain of 14% year-to-date. That number, however, tends to mask the fact that the U.K. equity market is virtually unchanged over the past five years.
With a deadline just weeks away, it’s worth asking if this is a time to take a flyer on EWU. We know that markets hate uncertainty which the U.K. is loaded with right now, but buyers tend to swoop in when the cloud tends to lift. If Brexit reaches some type of conclusion by the end of the month, U.K. stocks have the potential of igniting a relief rally. That, of course, depends on the actual outcome, whether Brexit is delayed, a withdrawal agreement is reached or something else altogether takes place.
From a macro view, the market is modestly inexpensive. It trades at 15 times earnings but also trades at a P/B of less than 2. Dividend seekers might also appreciate EWU since it often comes with a yield of more than 4%.
Recommendation: Only for risk takers.
If you’re willing to take a risk, EWU might provide a bump depending on the outcome of Brexit, but it’s far from a sure thing. A no-deal Brexit would probably be a negative for U.K. stocks so a scenario that would avoid that would likely be a positive for stocks. Still, this feels like a gamble and one that I would personally stay away from.
Disclosure: I am/we are long XBI,AAPL,COWZ,MCHI,QDF. I wrote this article myself, and it expresses my own opinions. I am not receiving compensation for it (other than from Seeking Alpha). I have no business relationship with any company whose stock is mentioned in this article.
[ad_2]
Source link Google News

