[ad_1]
Klaus Vedfelt/DigitalVision via Getty Images
After reading my most recent article, A Look Inside SPY and VOO: What’s Changed Since December 31, 2021, a friend asked me if the value of the Invesco QQQ ETF (NASDAQ:QQQ) was as concentrated in a small number of mega cap stocks as it is in S&P 500 ETFs discussed in that article. Those ETFs were the Vanguard S&P 500 ETF (VOO), The SPDR S&P 500 Trust (NYSEARCA:SPY) and The iShares Core S&P 500 ETF (IVV).
A quick look confirmed that QQQ’s top 10 holdings are almost identical to those of SPY. The major difference between the two ETFs is that because there are only 100 stocks in QQQ, each stock makes up a far larger percentage of the value of the entire ETF. So QQQ’s value is almost twice as concentrated in a handful of stocks as is that of the S&P 500 ETFs.
A Look at Major Large Cap ETFs’ Top 10 Holdings Reveals that Four Stocks Dwarf the Others the Top 10 in Impact
When I looked at the holdings of these two ETFs, I couldn’t help but notice the enormous impact that the stocks of only four companies have on the total performance of these ETFs. Those companies are Apple (AAPL), Microsoft (MSFT), Amazon (AMZN) and Alphabet. The latter appears twice the list of the Top 10 holdings of both SPY and QQQ as it trades via two different share classes, (GOOG) and (GOOGL). In the discussion that follows, I am counting Alphabet’s two share classes as one, as they are the stock of a single company, and their share prices fluctuate in lockstep with the fortunes of that one company, Alphabet.
Having looked at the role these four stocks play in the S&P 500 ETFs and QQQ, I wondered how large a role these four stocks play in two other huge, market cap weighted ETFs. Those were the Vanguard Total Stock Market ETF (VTI) and the Vanguard Growth ETF (VUG). When we add together the assets invested in SPY, QQQ, IVV and the total assets invested in VOO, VTI, and VUG while including the mutual funds of which they are share classes, we learn that these funds currently report having $3.123 trillion under management.
In the table below, you can see how much the share prices of these four top stocks contribute to the total value and share price of these popular ETFs.
Vanguard, Invesco, State Street Global Advisors Websites 
I only use the figures given by SPY in this table, but because VOO and IVV track the identical S&P 500 index, the percentages these four stocks make up of their holdings should be almost identical. SPY reports the weightings of its holdings daily, while VOO only reports them weeks after the fact.
After I looked up the AUM of each of these ETFs, including the mutual funds associated with the Vanguard ETFs, I calculated the percentage of their AUM that was invested in just those four stocks. This is what I found:
Dollar Amount of Top 4 Stocks in Major Broad Market ETFs
Vanguard, Invesco, SSGA, Blackrock. Table by the author. Websites
There is whopping $730.1 billion invested in just these four stocks just via these very popular ETFs. And these are only a few ETFs selected because they are among the largest cap weighted ETFs currently trading.
There are plenty of other market cap weighted ETFs that also hold a lot of shares of these four stocks. Though the ETFs that track the Tech sector only hold shares of two of these stocks, Apple and Microsoft, those two stocks make up 46% of the entire value of the Technology Select Sector SPDR Fund (XLK) and 39.95% of the Vanguard Tech ETF (VGT).
Dozens of other smaller but actively traded mutual funds also hold shares of these four stocks, and if they are market cap weighted, these four stocks play a significant role in their price behavior too.
The Future Performance of The Market, A.K.A. the S&P 500 Depends Heavily on These Four Stocks
When the financial media discuss “the market”, they are usually referring to the S&P 500. Given the role these four stocks play in that index, we can see what an outsized role these four stocks play in the returns of the market as a whole.
They have all seen their prices come down significantly in the past few months as investors have begun to worry about the impact of rising rates on tech stocks. Even though technically Amazon and Alphabet aren’t classified in as being in the GICS Technology Sector, most of us do think of them as tech stocks, no matter what some committee somewhere has decreed. The price declines in these stocks has, of course, contributed to the declines in share price that have made the S&P 500 correct and QQQ enter a bear market in the first quarter of 2022.
The question we should be asking now is whether the recent price declines these four powerful stocks have experienced have lowered their prices to levels that are healthy enough that investors don’t have to fear that one bad earnings report will send them–and thus “the market”– plunging even further.
So it’s time to take a closer look at what investors are expecting from these four stocks going forward.
These Stocks Have Been Valued as Growth Stocks But Are They Still Growing Like Growth Stocks?
All four of these stocks are considered growth stocks. None of them is to be found in a value index like the one tracked by The Vanguard Value ETF (VTV). So even though I am going to turn to my trusty FAST Graphs to get a sense of what investors expect of these companies going forward, I do it knowing that you can’t value growth stocks by applying the kinds of Graham-Dodd valuation formulas to them that you would use for evaluating a mature, slowly growing, dividend growth stock.
But can these four stocks really be growth stocks? These four companies have market caps far larger than the GDP of many developed nations. Apple’s current market cap is $2.525 trillion. Microsoft’s is $2.100 trillion, Amazon’s is $1.481 trillion. The combined market cap of Alphabet’s two share classes is the biggest of all four at $3.442 trillion. Just how much room there is for these companies to continue growing their earnings at the rate that brought them to their current dominating position.
Top Stocks of the Past Have Seen Their Fortunes Dwindle
The history of the stock market is the history of top stocks that were considered rock solid citizens of every shrewd investor’s portfolio whose fortunes have declines since their years of glory. General Electric (GE), IBM (IBM), and AT&T (T) all held the position Apple holds now.
You can see snapshots of what the Top 10 stocks in the S&P 500 were at different times over the past 40 years in this previous article. You can see the video depicting how their fortunes waxed and waned over 40 years here.
These faded once-Top-10 companies all hit the limits of how far they could grow. Then they morphed into stocks investors bought for their dividends, since their future growth was likely to be modest. Now they have relatively modest market caps compared to the current top stocks. Apple’s market cap is over 26 times larger than that of IBM’s $114 billion. Alphabet’s is almost 21 times that of AT&T’s $166 billion. Both IBM and AT&T were once the top stocks in the S&P 500.
The lesson we must take from this is that at some point growth stocks will stop growing. Has that happened to these top four?
The Sizes of these Top Four Stocks Currently Dwarf Those of the Other Top 10 Stocks
Looking more into the size of the market caps of these four companies, we see something concerning. Because once we move past these top four stocks, the market caps of even other stocks in the S&P 500’s Top 10 are far more modest. Johnson & Johnson (JNJ), for example, has a market cap of $445 billion. UnitedHealth’s market cap is $454 billion. Both are among the 10 largest stocks in the S&P 500 Index, but their market caps are roughly only one-seventh of the size of the market cap of Alphabet’s combined share classes.
A company’s market cap is made out of two elements: the number of shares of its stock available to trade and the price those shares trade at. Price is obviously the most volatile component of market cap. So we have to wonder is this huge discrepancy in market cap size due to the superiority of the businesses behind these four top stocks or a sign of overly exuberant investors assigning them prices that make no sense. If the latter is true, then these four stocks pose a serious risk to the market as a whole.
Let’s look at these four stocks now.
Apple’s Current Price, Earnings, and Forecast
Below you can see a chart depicting Apple’s earnings and price history since 2007. That was when Apple launched the iPhone and became the company it is now. The black line on the graph represents its price. The orange line represents the Price/Earnings ratio that would have corresponded to its price if its P/E ratio was the same as its average growth rate during the period graphed. The blue line represents the actual average P/E ratio that has prevailed through the entire period graphed.
Apple’s Price and Earnings History Since 2007
fastgraphs.com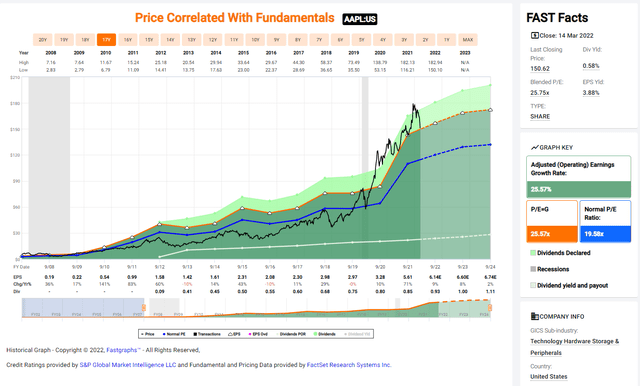
Using a classic Graham-Dodd approach, where you would expect the P/E ratio of a growth stock to correspond to its earning growth rate, we find that Apple’s average annual earnings growth rate of 19.58% was higher than the average P/E that has prevailed since 2007. This changed during the COVID-19 lockdown period. This suggests that until the lockdown investors were being cautious about Apple’s future growth prospects. But investor enthusiasm took off during the lockdown and Apple’s earnings did too, until the beginning of this year, when they declined about 13% as the Tech sector swooned.
This graph might suggest that Apple has now reached a price that gives it an appropriate P/E ratio for its growth rate. That would be a mistake. That average annual growth rate is backward-looking and includes the huge surge in earnings that occurred during the COVID-19 lockdowns.
Do the same investors who were so cautious while Apple was bringing the iPhone and its accessories to market and profiting mightily from the App Store suddenly see some reason to believe that Apple can grow even more robustly in the next few years than it did during the past decade?
Take a look at analysts’ forecasts for Apple’s future earnings, which you can see in the FAST Graphs Forecasting Calculator graph below. It suggests that if investors are thinking that way, they may be in for a nasty surprise.
This graph shows you what price Apple shares would sell at if the company were to continue to maintain the 19.58 P/E ratio that has been its average P/E ratio since 2007.
Apple’s Forecasted Earnings and Prices at Different P/E Ratios
fastgraphs.com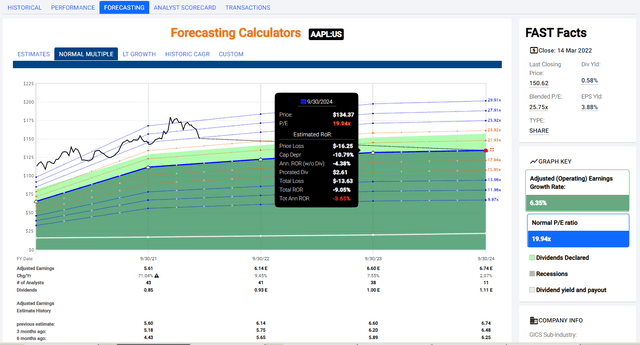
Large numbers of analysts have provided forecasts for Apple’s annual earnings out to 2024. Those forecasts have been rising over the past few months as shown on the bottom three lines on this chart. They show you what analysts had been forecasting 3 and 6 months ago. But as you can see, the earnings growth rate the analysts are projecting for Apple are very modest. They are all under 10% a year going out to the end of fiscal 2024, and average only 6.35% over the three-year period covered.
If Apple investors revert to giving Apple the same valuation they have given it since the first iPhone launched, Apple’s price would likely come down to the price level depicted by the blue line on this graph, or even possibly lower. And don’t forget, that is the P/E ratio investors assigned Apple when it was growing earnings at far more robust rates. If Apple shares were to end up priced at a P/E ratio more in line with that 6.35% annual growth rate, its price would decline a lot more.
This suggests Apple is still coasting on the euphoria caused by its huge surge of sales generated during the COVID-19 lockdowns. Its share price also appears to have benefited from the huge influx of young investors who began investing in the market during that lockdown whose use of options, according to the Financial Times, appear to have, at times, turned Apple into a meme stock.
Many of these young investors have been burned by the losses they have experienced since last year’s high. Many more are still sitting on gains they may be getting nervous about keeping. They have seen other popular stocks’ prices crumble, in particular, Meta’s (FB). This may make them very twitchy if Apple’s next quarterly report does not reveal earnings that provide a double digit surprise to the upside the way that their last one was.
Meta’s History Shows What Happens When A Top 10 Company with a High Valuation Doesn’t Meet Lofty Expectations
Meta is the company previously known as Facebook. Its stock was among the S&P 500 and QQQ’s top 10 stocks until just this week. That’s because its market cap has tanked entirely due to its 43% price decline YTD, a decline caused mainly by disappointing guidance.
A look at Meta’s FAST Graphs should really make investors in the top four stocks think. Meta’s stock was the 5th largest holding in the S&P 500 during 2021. Not only that, but unlike Apple and the other stocks we are going to look at, Meta appeared to be priced fairly in view of what its historical P/E ratio had been and what its expected future earnings were supposed to be.
Meta Price and Earnings History
fastgraphs.com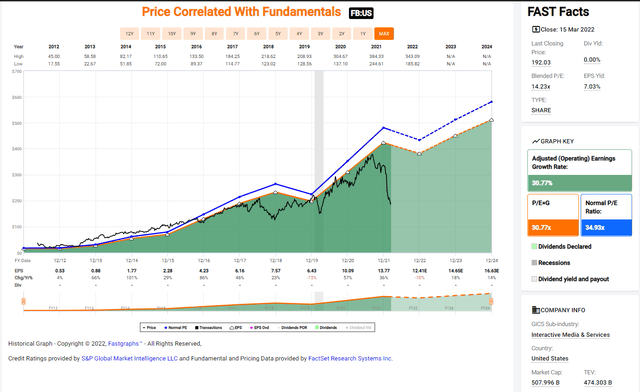
But though its earnings for 2021 did meet analysts’ expectations, its weak future guidance sank its price by almost half. Its P/E ratio was 28.69 before its price began its catastrophic decline. Meta’s stock is now sitting at a price that gives it a P/E of only 13.83.
This kind of swift and devastating price decline could happen to any one of the top four stocks we are discussing here if they were to disappoint investors. It should give us pause to realize that unlike Meta, the top four stocks we are looking at are all currently priced in a way that gives them a P/E ratio above the level that matches their expected earnings.
Apple Could Easily Lose 35% of its Current Price if it Disappoints Investors
Getting back to Apple, consider for a moment what Apple’s price might be if its P/E were to decline to just 15, which would be an appropriate P/E ratio for a stock whose annual earnings are only forecast to be about 6% a year. With its currently forecast earnings and a 15 P/E, Apple shares could reach a price of only $101.10 by 2024. That would represent a loss of almost 35% from its current share price.
Alphabet’s Current Price, Earnings, and Forecast
Alphabet trades via two separate share classes, the older one GOOGL, and GOOG. Only GOOGL shares have voting rights, so they would be the shares held by insiders. As you can see, the two share classes have traded identically except for a brief period from May to August 2021.
Alphabet’s Two Share Classes’ Price History
Seeking Alpha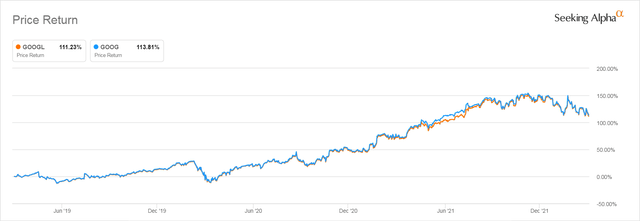
Each share class has a roughly similar market cap. In the rest of this analysis, we will look only at the older GOOGL shares to keep things simple.
Here is what GOOGL’s price and earnings history looks like, graphed by FAST Graphs.
Alphabet Class A Price and Earnings History
fastgraphs.com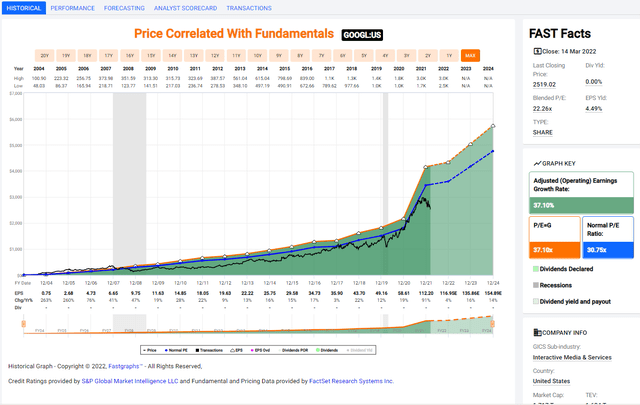
GOOGL’s price has tracked its usual P/E ratio more sedately than Apple’s has throughout its history, until its price dropped along with Tech stocks since the beginning of 2022. That more sedate pace of price growth may have something to do with how expensive its shares are. At over $2,500 a share, young investors were far less likely to fool around with the options which could have made its stock price more volatile.
Alphabet, too, saw its earnings surge, thanks to the COVID-19 lockdown and the huge influx of people who were forced online. FAST Graphs tell us that its average annual earnings growth rate from 2011 to 2019 had been 20.04%. Last year’s 91% annual earnings growth rate was a huge outlier.
So we need to think about what prospects are for its future growth. Did that 91% growth include what might have been the growth seen over the next five years? Could earnings possibly continue up from their current level, or do they adjust down to be more in-line with where they might have been had COVID-19 not happened?
Analysts are forecasting an average annual growth rate of 11.45% through 2024. But they are also forecasting 2022’s earnings growth to be only around 4%.
Alphabet is Closer To Fair Value But Could Still Drop at Least 7.1%
If Alphabet grows earnings by single digits in 2022, will that spook investors who have already seen their stock price drop 13% since the beginning of 2022? If GOOGL were to earn what analysts are currently expecting them to earn per share in 2022, and disappointed investors assign the stock a price that gives it the kind of 20-ish P/E it has usually had over the past decade, its price would hover around $2,339. This would represent a decline of another 7.1% from the current price level. Of course, if Alphabet’s guidance disappoints investors this year, it might well follow in Meta’s footsteps.
Challenges Alphabet faces include increased antitrust scrutiny from the EU and possible future action by US anti-trust regulators.
Microsoft’s Price, Earnings, and Forecasts
I have written at length about Microsoft’s valuation and given some price targets that would provide safer entry points in a recent article so I won’t repeat myself here. Here is what its stock looks like using FAST Graphs’ Forecast feature to see how its current price fits in with its average multiple over the past 5 years. That multiple is a very hefty 27.11.
Microsoft’s Forecast Earnings vs. its 5-Yr Average P/E Ratio
fastgraphs.com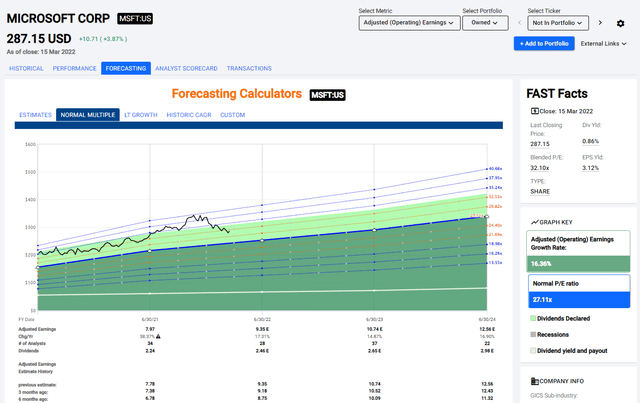
Microsoft Could Drop Anywhere from 12% to 29% And Be Fairly Valued
Even applying that hefty multiple, you can see that Microsoft’s current price would have to drop a lot more to give it the same valuation it had in the recent past, though it had already dropped over 3% between March 15 and when my article was published a month ago. If it were to revert to its usual valuation, its shares would be priced around $253 at the end of its fiscal year this June. This would represent a further decline of roughly 12%. However, Microsoft is expected to grow earnings fast enough for the share price to recover just a year later.
But that assumes that Microsoft maintains its elevated valuation, represented by its having maintained an average P/E ratio near 27. If Microsoft’s share price were to decline to a level that fits its predicted future growth rate using the P/E=G rate, its price would be cut almost in half–near $152/share. If it maintained that P/E ratio, it would only recover to a price of $205 by June of 2024, leaving investors with a further 29% loss.
And, of course, if its actual earnings are worse than what are expected, it could decline a lot more. Microsoft also has exposure to the same EU antitrust issues that face Alphabet.
Amazon’s Price, Earnings and Forecasts
Amazon, like the last three stocks we have looked at, saw a huge gain in its earnings in 2020 during lockdown. But unlike the other three stocks, Amazon’s price stayed flat during 2021 before it declined along with the market as a whole.
But attempting to predict Amazon’s future price behavior based on any kind of rational basis is a fool’s errand. As you can see from the FAST Graphs’ Analyst’s Scorecard below, even the pros have done a lousy job predicting its earnings over the past decade, even when they were just looking one year ahead. FAST Graphs allow analysts a large margin of error, so those red scores, and the extent to which analysts miss the actual earnings with their forecasts really stand out.
fastgraphs.com
The reason for their misses has to do with the fact that Amazon’s immense and swelling revenues often don’t trickle down to earnings per share. Amazon has always traded at such a high price that it has felt no pressure to increase earnings to attract investors. At least not until the past year and a half.
Its share price and earnings history over the past decade look like this:
fastgraphs.com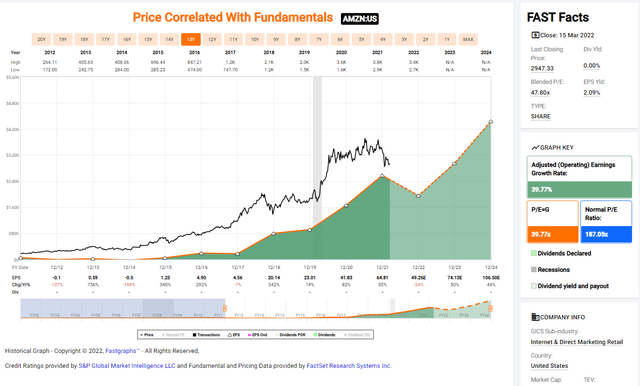
You will note that I removed the blue line that depicts the “normal P/E ratio” from this graph as it is distorted by the years when Amazon’s P/E ratio soared well over 1,000. That is what happens when a company whose share price is over $300 a share reports earnings per share in the pennies.
Applying the formula P/E=G to its predicted earnings for 2022, which are $49.26–which, as we saw, is a prediction we can’t trust–and to its average P/E ratio of 39.77, we would get a price for Amazon of only $1,959 per share. This would represent a decline of 34%–and that would be with Amazon still valued at a P/E near 40. Though Amazon will actually earn and how patient investors will be after more than a year of disappointing price returns is impossible to predict.
Amazon recently announced a 20/1 stock split, which is obviously an attempt to boost its share price by cheapening shares to attract investors without having to address its decades of extreme valuation.
But you have to wonder about Amazon’s future. We are in an inflationary period that could lead to a recession, which will limit consumers’ ability to buy anything but essentials. They will be more likely to hit ALDI’s than Amazon should that happen.
Amazon has also lost Bezos’ leadership, as he stepped down from the CEO position on July 5, 2021. This may put Amazon in the situation Apple was in after Jobs left the first time. We’ll soon find out. So it seems safe to say that Amazon too could easily see its price drop by 33% or more.
Bottom Line: Keep Your Eye on These Four Stocks: If They Move Downward, the Whole Market Is Likely to Follow
It is always possible that these four stocks will continue to trade at levels that can’t be justified by any traditional valuation methods. But the real issue here is whether they can even continue trading at prices in line with where they were before the COVID-19 lockdown.
Apple could easily drop 35% if its earnings are in line with current predictions. Microsoft could drop 29%. Amazon, though it is more difficult to predict its future share price, could reasonably drop 33%. Alphabet would only drop around 7%. That amount of price decline would take away 5.45% of the S&P 500’s current value (and price) and eat up almost double that for QQQ.
And those price declines would occur if these stocks only reverted to a valuation in line with fair value. It is also possible they might live up to current earnings expectation, but see their prices decline below that fair value in response to their earlier overvaluation. This could happen in response to a change in investor sentiment caused by inflation, rising rates, or world political turmoil.
Their prices could drop sharply no matter what overall market sentiment might be if these stocks report disappointing earnings or even just disappointing future guidance, as Meta did. That would cause a far greater decline in the price of the S&P 500 and the other ETFs that hold large positions in these four stocks.
ETF Investors Need to Look at the Holdings of their ETFs to See How Exposed They Are to These Four Stocks and Follow Them to Stay Safe
Investors with large investments in market cap weighted ETFs and index funds are at the greatest risk of experiencing unexpected future losses because they rarely keep up with the fortunes of individual stocks. Based on the many thousands of posts I’ve seen on forums like Bogleheads, many ETF investors aren’t aware of how large a role these handful of stocks play in their investment results, as they believe they “own the whole market.”
If you are an ETF investor, take a moment to visit the site of the company that provides your ETF and check out your ETF’s “portfolio” or “holdings” information to see how heavily invested your ETF is in these four potentially dangerous stocks.
If you find you are invested in market cap weighted ETFs that hold a significant percentage of these four stocks, keep a close eye on financial news stories about them. One false step, one bad quarter, one piece of worrisome management guidance could be devastating not only to holders of these individual stocks but to the large ETFs and index funds that, as we have seen, hold trillions of dollars worth of these four stocks. If these bellwether stocks go down, a lot of other stocks will be taken down with them, as the investors who have put those trillions of dollars into those large cap ETFs head for the exits hoping to preserve what’s left of the huge gains that they made since 2020.
[ad_2]
Source links Google News

