
By Bill O’Grady, Patrick Fearon-Hernandez, CFA, and Mark Keller, CFA
In our 2022 Outlook: The Year of Fat Tails, we outlined a forecast with a higher likelihood of events outside the norm. To compensate for the unusual level of uncertainty, we promised to provide frequent updates to the forecast. This report is the second of the year. In the most recent update, we offered four scenarios for the path of monetary policy. Since we published that report in February, the world has seen even bigger changes. The war in Ukraine and the subsequent freezing of Russia’s foreign reserve assets have changed the world in a profound manner that will take years to fully determine. Nevertheless, one change we think is permanent is that globalization as we have practiced it since 1990 is over.[1] That change will have serious ramifications on financial markets.
In the past few weeks, market conditions have changed rapidly. It has become nearly impossible to construct a detailed outlook simply because the details are in flux. In order to offer some structure to our current thinking, this will be a short report with price/yield in an effort to at least provide directional guidance.
Content continues below advertisement
Key Forecasts:
- 10-Year Treasury: 3.60% to 3.75%, with caveats about the business cycle (see below)
- S&P 500: Range of 4200 to 3400
- Dollar: Bullish for the rest of the year
- Commodities: Very vulnerable to cyclical factors, but secular trend is favorable
The Economy
The economy isn’t in recession now, and we don’t expect it to enter a downturn this year, but the odds are significantly higher in 2023.
This is a chart of the Chicago FRB National Activity Index smoothed with a six-month average. Any reading below zero is a concern, but a recession isn’t signaled until it reads -0.45. The current reading shows us comfortably above trend and nowhere near recession.
Inflation has spiked higher over the past 15 months, reaching levels not seen since the early 1980s.
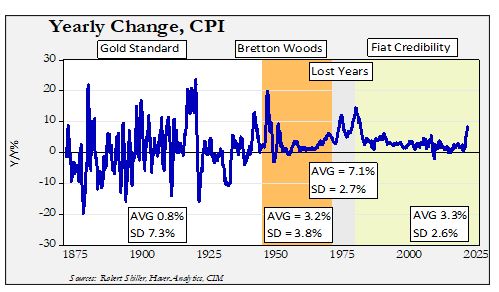 A number of factors have contributed to this inflation event. The pandemic upended global supply chains. Aggressive fiscal and monetary policy flooded the economy with liquidity. The level of liquidity “floated all boats,” at least initially, leading to higher goods prices but also lifting asset prices. The Ukraine war disrupted commodity supply chains and lifted price levels further. The Federal Reserve initially thought that as COVID-19 waned, supply chains would heal and the supply-side pressures on the economy would ease. Although inflation would have remained elevated relative to history, the Fed could slowly tighten monetary policy and bring inflation back to target. In fact, the consensus forecasts for inflation support the idea that inflation would be “transitory.”
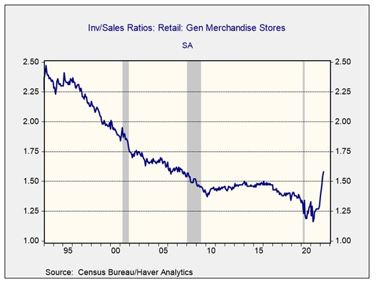 We do expect inflation to ease in the coming months, for no other reason than base effects. In addition, supply chains are improving and there is growing evidence of a “buyers’ strike” as inventory/sales ratios are rising rapidly at general merchandise stores.
We don’t expect a recession in 2022, but the odds of one in 2023 are above 50%.
Fixed Income
There are three areas we will cover in this section—monetary policy, long-duration Treasuries, and credit spreads.
 Although there are numerous ways to examine monetary policy, a simple approach is to measure policy compared to inflation and unemployment. This concept is found both in the Phillips Curve, which argues there is a tradeoff between unemployment and inflation, and the Mankiw Rule, which uses a formula to estimate a proper level of fed funds. This chart shows where we are currently.
The indicator is generated by subtracting the yearly change in CPI from the unemployment rate. During the 1970s, this indicator persistently moved above zero. After Volcker, the Fed tended to begin raising rates before this indicator hit zero. This policy, known as “pre-emption,” was based on the idea that policy should be tightened in anticipation of higher inflation. The FOMC has recently moved away from this policy, moving to an average inflation reaction function that was never fully defined. But, in any case, the Fed has clearly allowed the economy to “run hot” and that has led to a serious overshoot of inflation.
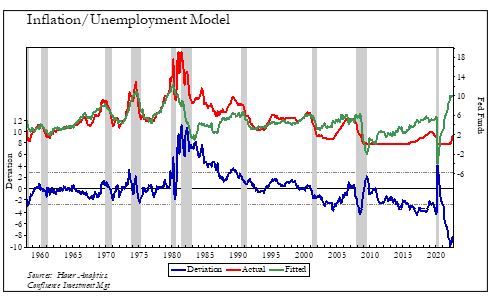 A model of the indicator to fed funds shows that even in the 1970s the policy rate was raised in tandem with signals from the indicator. Unfortunately, inflation continued to rise through this period. Finally, Paul Volcker lifted the policy rate to well above the model’s fitted levels, which appeared to break the inflation psychology. Interestingly enough, this model shows that policy has never been this easy since the late 1950s.
The FOMC is clearly “behind the curve.” It will be difficult to move the deviation line within normal bounds without rising unemployment. Even to move it to the lower bound would require 500 bps, either through rate hikes, falling inflation, or rising unemployment. So, if we assume fed funds are raised to 3.75%, then inflation would need to fall by 2% or unemployment rise by the same amount. A rise in the unemployment rate of that magnitude would trigger a recession via the Sahm Rule.
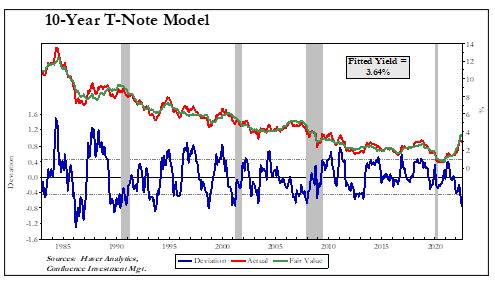 Our 10-year T-note model uses the 15-year average of CPI (which acts as a proxy for inflation expectations), the five-year standard deviation of CPI, the level of fed funds, the yen/dollar exchange rate, German 10-year Bund yields, oil prices, the fiscal deficit/GDP, and a binary variable reflecting unified government.
The current 10-year T-note yield is below our fair value estimation, which is concerning because the yield isn’t reflecting the most likely path of the policy rate. The recent rise in German Bunds has lifted the fair value rate. There is some help on the horizon as a GOP takeover of at least one house of Congress would likely ease the fair value yield by some 33 bps.
This situation begs the question…why hasn’t the bond market factored in what is clearly a path toward tightening? Here are the possibilities:
- The bond market doesn’t believe the FOMC will tighten as much as the market thinks; once financial conditions deteriorate enough, the Fed will “blink.”
- The bond market believes the FOMC will induce a recession.
- The bond market is seriously underestimating future inflation.
There is some evidence that the market is building in expectations of both points #1 and #2
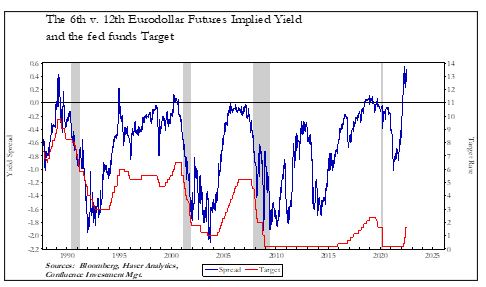 This chart measures the implied yields from the sixth and 12th Eurodollar futures contracts; the former is for yields about 18 months into the future, and the latter is about three years. Most of the time, the spread is negative, which is consistent with an upward sloping yield curve. But when the spread becomes positive (the nearby has a higher yield than the deferred), it tends to signal that the central bank is near the end of its tightening cycle. On average, the last rate hike occurs six months after the spread turns positive. Since the spread moved positive in February, that would imply the Fed might be done by August. The longest period was 11 months, which would put the last rate hike early next year.
This chart relates to point #3 above. Until the recent inflation spike, the 10-year TIPS yield and the nominal 10-year T-note yield less core CPI tended to track closely. Clearly, the relationship has broken down, with the TIPS market suggesting the current inflation won’t last. As we have been pointing out in the 2022 Outlook and most recent update, the most potent risk facing the financial markets is if the 10-year T-note yield normalizes to inflation. Since the long-term ex-post average yield on the 10-year is 2%, even a 4% inflation rate implies a 6% nominal yield.
Another worry is that the FOMC finishes tightening without actually achieving a positive real-policy rate, i.e., the fed funds rate remains below inflation. Although in the short run that would likely support long-duration Treasuries, in the long run such action would undermine bond market confidence in the Fed’s inflation control. Thus, the end of tightening could be good news in the short run but more of a problem in the long run.
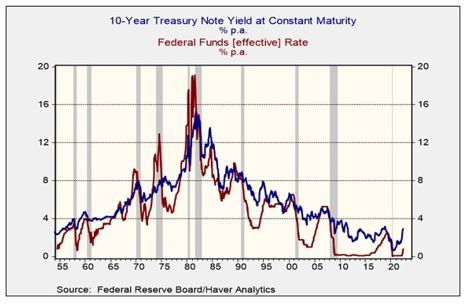 On the other hand, if the bond market expects a recession, then the current yield might be justified. History shows that as a tightening cycle progresses, the 10-year T-note yield usually stops rising or falls below the level of fed funds, signaling an inversion and recession. We are not there yet, but if the 10-year yield doesn’t rise as the FOMC lifts rates, it would explain what looks like a low yield on the 10-year relative to inflation and the economy. So, the path of the 10-year T-note over the next few months will likely resolve this unknown. But, for now, it would seem risky to assume that long-duration Treasuries will offer much protection until there is clear evidence of recession.
 Until evidence that a recession is imminent (defined as within the next six months), we look for 10-year T-note yields to rise toward 3.70%.
Credit spreads are widening, but modestly.
As financial conditions deteriorate, we would expect credit spreads to widen. Most recessions, especially since 1970, have seen credit spreads widen into the downturn. One standard deviation rise would lift the above credit spread by 80 bps. The risk of credit is rising; if the Fed is going to weaken financial conditions, it is imperative that credit spreads widen.
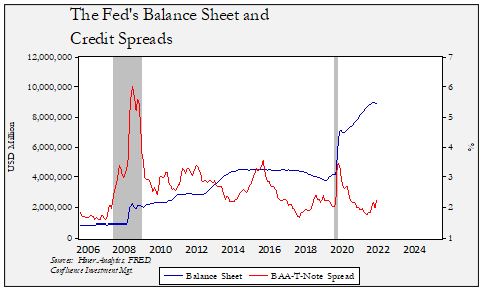 The impact of quantitative easing (QE) and tightening (QT), the deliberate expansion or contraction of the Fed’s balance sheet, remains controversial.
As this chart shows, QE has tended to narrow credit spreads, whereas periods of a stable balance sheet, or QT, tend to widen spreads. With QT underway, it would make sense that credit spreads would widen in the coming months.
Equities
In this update, we will focus on updating our S&P 500 forecast. In our initial report, we projected a 5000 level for the index this year. We discuss our current thinking in this section.
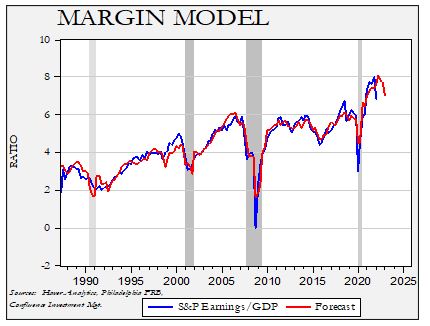 The basic way to project an equity index is to estimate earnings and then apply an estimated multiple. We will start with earnings. The estimation process begins by comparing total S&P operating earnings to nominal GDP. For Q1, these earnings represented 6.8% of GDP, down from 8% in Q4 2021.
Our model suggests a recovery in earnings relative to GDP in Q2, but a decline from the forecast peak in the second half of the year (H2). Still, earnings are expected to be elevated compared to history. Using this margin forecast and the consensus for nominal GDP, we see earnings for 2022 coming in at $232.85 per share.
The next step is to determine the multiple. Our model uses CPI and the five-year rolling deviation of CPI, fed funds, M2 growth, the fiscal deficit, 10-year yields, and the level of retail money market funds.
For 2022, our ending multiple is 15.6x. Our base case expects a recovery in 2023, while the high inflation case would mean the multiple holds near year-end levels.

The strongest argument for a higher multiple is that liquidity levels remain elevated.
Using the Distributional Financial Accounts data from the Federal Reserve, we can estimate the cash levels per household by income class. The top 10% hold 80.3% of equities, so their cash levels are important to available liquidity for assets, in general, but stocks, in particular. All three groups saw cash levels rise during the pandemic (with the bottom 50% seeing strong proportional gains), but the pace of growth has started to decline. We should also note this data only goes through the end of the first quarter. So, given the jump in inflation, it is quite possible that cash levels have already started to decline.
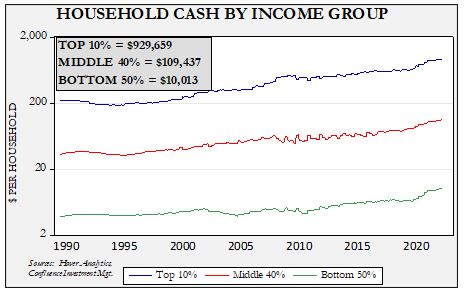
In some respects, in order to contain inflation, the FOMC may need to lift the return on cash to a level where households are simply content to not spend or invest the funds. In other words, make cash an asset class again. It’s unclear where that level of interest rates would reside, but one would expect it to exceed the inflation rate. Still, if inflation does ease and expectations of future inflation decline, there is ample liquidity to lift asset prices…or inflation as well.
We are lowering our upside forecast for the S&P 500 to 4200, with a downside of 3400.
Other Markets
Foreign Exchange: Our expectations of dollar weakness have clearly been wrong. Exchange rates are notorious for focusing on a narrow set of factors through various periods. For example, in the early 1980s, interest rate differentials drove the dollar. By the mid-1980s, the trade deficit was the critical factor. In the early 1990s, interest rates mattered again, only to see relative productivity rates move the dollar into the early part of the century. Growth differences seemed to drive the dollar into the Great Financial Crisis; after that, interest rate differentials returned until the middle of the last decade, when financial stability seemed to matter. We rely on parity models, which measure the difference between inflation rates to set exchange rates. Although such models are not reliable for trading, they do show when an exchange rate has reached an extreme. Before the Ukraine war, they were signaling that the dollar was overvalued.
The war has upended the currency markets. The Bank of Japan’s decision to maintain yield curve control has sent the JPY to multiple-decade lows. The European Central Bank’s attempts to prevent peripheral nation bond yields from widening could develop into a form of yield curve control as well; the EUR is vulnerable to further weakness. The GBP is under pressure, in part, due to the slow tightening response from the Bank of England. Adding to pressure on the British currency are the unresolved issues of Brexit. Meanwhile, the FOMC seems focused on inflation and the Biden administration has been silent on the topic of dollar strength. Although we don’t expect the dollar to maintain this strength indefinitely, the dollar will probably remain strong for the rest of this year.
Commodities: Until recently, it’s been a good year for commodities. Global supply chains have been roiled by the pandemic and the war, while the recovery from the pandemic has lifted demand. Meanwhile, ESG issues have stifled the usual supply response we have come to expect from higher commodity prices. Although commodity prices will always be sensitive to the business cycle, we think we are in a long-term bull market in commodities that has further upside.
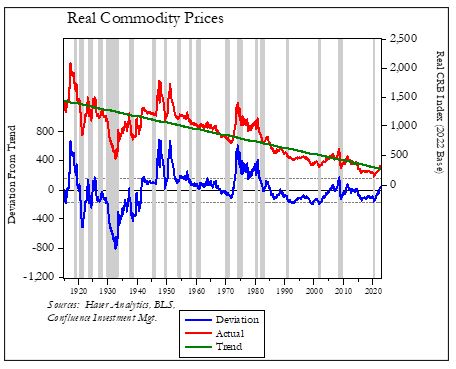 This chart shows the inflation-adjusted CRB commodity index over the past 107 years. The declining trend line shows that, over time, commodity prices tend to fall relative to inflation. But, as the deviation line shows, there are periods of outstanding commodity performance. These events are often tied to wars and/or monetary events. For example, the massive commodity outperformance in the 1970s was tied to the end of the Bretton Woods system. Since 1980, commodity markets have mostly underperformed inflation. Outside of the China-fostered commodity boom before the Great Financial Crisis, the inflation-adjusted CRB mostly traded below its long-term trend. We recently saw commodities rise modestly above trend.
We think the end of widespread globalization and the end of U.S. hegemony increases the odds of a commodity bull market similar to war years or the 1970s. As this chart would suggest, if that outcome does develop, there remains significant upside to commodity prices. Although a recession would likely be bearish for commodities, that price weakness is likely to be temporary. At the same time, this weakness shouldn’t be underestimated. The pullback in commodities during the 1973 recession was substantial.
[1] For details, see our Bi-Weekly Geopolitical Reports from March 14, March 28, April 25, and May 9. We also recommend our podcast episodes associated with these reports.
This report was prepared by Bill O’Grady, Patrick Fearon-Hernandez, and Mark Keller of Confluence Investment Management LLC and reflects the current opinion of the authors. It is based upon sources and data believed to be accurate and reliable. Opinions and forward-looking statements expressed are subject to change. This information does not constitute a solicitation or an offer to buy or sell any security.
Confluence Investment Management LLC
Confluence Investment Management LLC is an independent Registered Investment Advisor located in St. Louis, Missouri. The firm provides professional portfolio management and advisory services to institutional and individual clients. Confluence’s investment philosophy is based upon independent, fundamental research that integrates the firm’s evaluation of market cycles, macroeconomics and geopolitical analysis with a value-driven, company-specific approach. The firm’s portfolio management philosophy begins by assessing risk and follows through by positioning client portfolios to achieve stated income and growth objectives. The Confluence team is comprised of experienced investment professionals who are dedicated to an exceptional level of client service and communication.