[ad_1]
YieldShares High Income ETF (NYSEARCA:YYY) is an income-focused exchanged traded fund that tracks a basket of closed-end-funds, essentially an “ETF of CEFs”. One of the advantages of CEFs is that it’s a good structure to implement illiquid strategies across various asset classes, and often times, these are the types of securities that offer the highest yield, which is the focus of YYY. The YieldShares High Income ETF is comprised of 30 CEFs selected by overall highest fund yield, discount to net asset value, and liquidity. The result is a diversified portfolio across investment strategies and asset classes that currently yields 8.7% and makes monthly distributions. This article looks at the characteristics of YYY including the performance metrics for its underlying holdings.
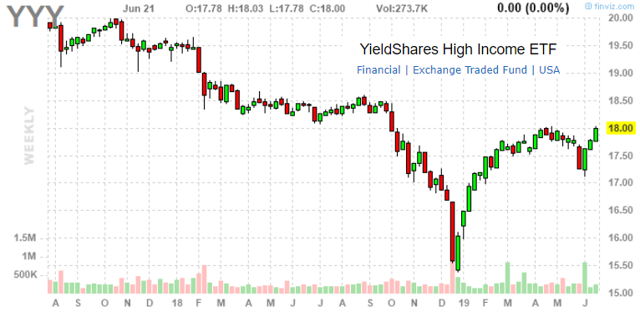
YYY weekly price chart. Source: FinViz.com
YYY Key Stats
The first thing to note is that within the 30 CEFs, the total exposure breakdown is about 25% equities and 75% bonds. The top 10 CEFs together represent 48% of the total weighting and the top holding is given a 4.6% weight. There’s relatively broad diversification across global regions with 28% of underlying investments outside North America. On the other hand, there is a concentration in the equity holdings among energy sector stocks at 49%. In the bond holdings, nearly 72% of the securities have a “non-investment grade” credit rating below BBB, which simply reflects the source of the aggregate high yield.
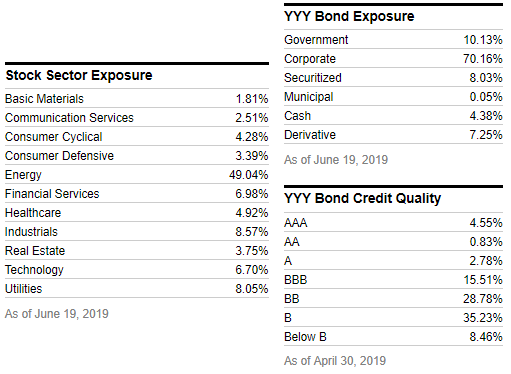
YYY stock and bond exposure metrics. Source: YCharts
Based on the published fundamentals data, the stock holdings exhibit a blended value-growth large-cap factor style, resulting in a weighted average PE ratio of 15.38. The bond holdings present an effective duration of 4.509 years. Duration of the bond portfolio reflects sensitivity to changes in interest rates. The higher the duration, the larger the losses of an equal increase in interest rates all else equal. Given that YYY fixed income holdings represent ~75% of total underlying holdings exposure, the actual duration of exposure of the ETF is lower and by my estimate at ~3.368. As a reference, the iShares iBoxx USD High Yield Corporate Bond ETF (NYSEARCA:HYG), which is a benchmark among high-yield fixed-income securities, has a duration of 3.365. By this measure, YYY has similar interest rate risk to HYG while at the same time benefiting from equity holdings that may have higher appreciation potential among the underlying CEFs. CEFs within YYY also invest in convertible bonds and preferred equities. The high yield achieved through various asset classes and investment strategies is a positive attribute of YYY.

YYY stock and bond fundamentals metrics. Source: YCharts
YYY Underlying Holdings Performance Data
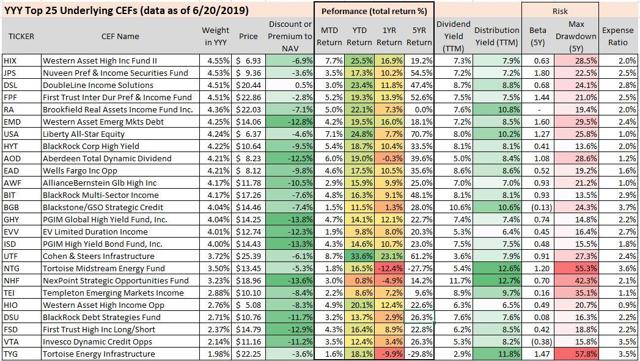
YYY’s underlying CEFs’ key stats. Source: Data by YCharts/ author table
The table above presents some of the key metrics for the top 25 out of 30 CEFs in YYY. The average CEF discount to NAV was last reported at 9.8% as of May 31, 2019, by the fund manager, although my data finds the discount has tightened to under 9% as of June 20, likely as a result of the strong equity and bond markets performance this month with improved risk sentiment. Indeed, YYY is up 4.3% month-to-date in June as global asset prices have rallied with bond prices in particular supported by dovish monetary policy signals by the Fed in the latest June FOMC meeting. Still there is a wide variance of returns between year-to-date figures and the total returns over the past year. YYY is up 16.6% YTD, but only 6.9% over the past year on a total return basis. A number of CEFs in YYY have negative total returns over a one-year holding period, despite the strong gains in 2019.
The Western Asset High Income Fund II (NYSE:HIX) is the largest holding in YYY with a weighing of 4.55%. HIX invests in high-yield fixed-income across corporates and foreign government issuers. The fund has returned 25.5% in 2019 and has a distribution yield of 7.9%.
Cohen & Steers Infrastructure Fund (NYSE:UTF) is the best performer in 2019, up 33.6% on a total return basis. UTF is an equity fund and holds a number of growth REITs that have been big winners including American Tower Corp. (NYSE:AMT) and Crown Castle International Corp. (NYSE:CCI) among its top holdings. On the other hand, the Tortoise Midstream Energy Fund (NYSE:NTG) is the biggest loser, down 12.4% over the past year. NTG has a large concentration in energy infrastructure and pipeline master limited partnership “MLP” equities.
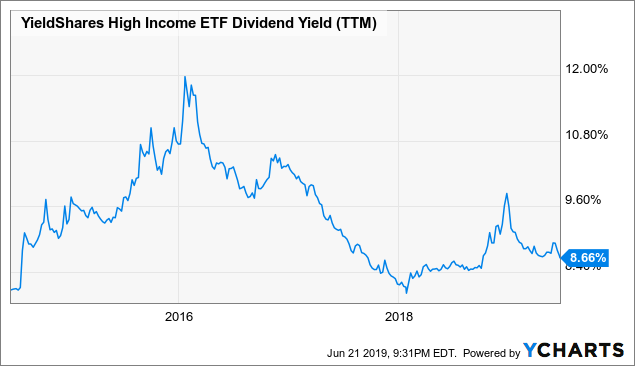
YYY’s dividend yield is 8.66%. This reconciles with the individual funds each with a distribution yield in the table above between 6.4% and 12.7%. The NexPoint Strategic Opportunities Fund (NYSE:NHF) has the highest distribution yield over the trailing 12 months at 12.7%.
 Data by YCharts
While these types of yields are enticing, it’s important to remember that it comes with corresponding risk, and the drawdown data for the individual CEFs highlights potentially large swings in volatility inherent in YYY over the last five years. YYY itself has a max drawdown of 26.28% between Q2 of 2014 and Q1 of 2016. This period was marked by weakness in commodity prices that pressured emerging markets including energy sector investments that YYY has had exposure in. The dividend yield for YYY rose as high as 12% in 2016 and trended lower until Q1 2018. During Q4 of 2018 when the market observed historically high levels of volatility into December, YYY fell to a low of $15.4, representing a dividend yield at the time at 10.1%. The rally in YYY this year has reversed some of those losses while the actual price of the ETF is back to a level it last traded at September 2018.
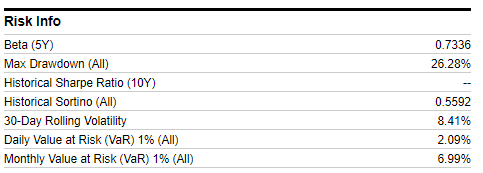
YYY Risk Metrics. Source: YCharts
Analysis
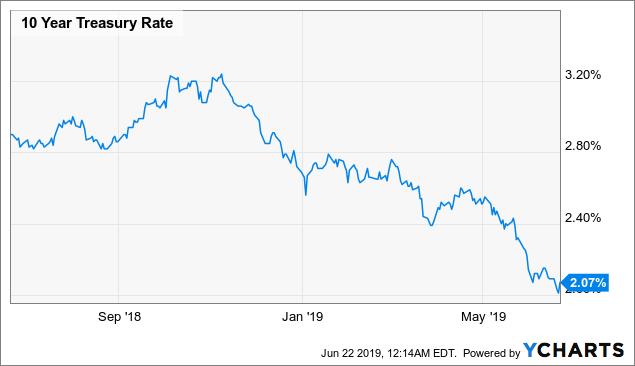
Given the significant exposure to fixed income securities, the interest rate outlook is among the main risk considerations. Periods of falling interest rate should generally be favorable to bond holdings of the underlying CEFs all else equal. The current environment of falling long-term rates including a 10-year Treasury yield approaching 2% has supported the performance of YYY this year. In terms of credit, narrowing spreads among lower-rated securities should also be favorable to the fixed-income exposure. Considering the near 50% exposure to the energy sector among the equity holdings of the underlying CEFs, the overall macro outlook including improved risk sentiment in the past few weeks, a falling dollar, and rally in energy prices are also positive to YYY. Expectations of weaker economic growth going forward remain an important monitoring point.
 Data by YCharts
Proposed Name Change to Amplify High Income ETF
One important development to be aware of is a proposed name change to YYY. On June 10 2019, the fund manager of YYY filed with the SEC a notice scheduling a shareholders’ meeting for August 1, 2019, to vote on a proposed reorganization and name change into the “Amplify High Income ETF”. There are no changes to the investment strategy, and shareholders will not incur any fees or costs associated with the move. YYY will simply be known as the Amplify High Income ETF if the proposal is approved.
Conclusion
YYY is a good option to consider to gain passive exposure to high-yield CEFs. Be aware that there are a number of risks that could cause a loss in principal over any particular time frame going forward. The fund charges a management fee of 0.50%, which is on top of the cumulative fees from the underlying CEFs. The total expense ratio is 2.28%, which is consistent with the asset class and reasonable considering the yield opportunity. If considering an allocation to this fund, my suggestion is to accumulate a position slowly over time by averaging in at attractive prices.
Disclosure: I/we have no positions in any stocks mentioned, and no plans to initiate any positions within the next 72 hours. I wrote this article myself, and it expresses my own opinions. I am not receiving compensation for it (other than from Seeking Alpha). I have no business relationship with any company whose stock is mentioned in this article.
[ad_2]
Source link Google News

