[ad_1]

shulz/E+ via Getty Images
Today, we continue the series of articles discussing the tech-focused exchange-traded funds with a note on the SPDR S&P Software & Services ETF (XSW).
Incepted in September 2011, XSW is a passively managed smart-beta fund with an around $330 million portfolio mixing U.S. equities with sizes ranging from mega- to small-caps. Its gross expense ratio is 35 bps, which compares favorably to the asset class median of 47 bps.
I believe the fund’s risk/reward profile is tilting towards risk, making it an unappealing option at these levels.
Its Achilles heel is a precarious combination of overstretched valuations together with flimsy margins and only nascent growth stories (excluding a few heavyweights) typical for the sub-industries of the IT and communication services sectors it is supposed to mimic the performance of. We will be discussing its bleak quality (i.e., exposure to cash-burning, unprofitable companies) in greater depth below in the note.
Considering that tech bears are seemingly entrenching, I highlight the fund’s inherently higher sensitivity to the reduction of growth premia across the board, with mid-cap tech, its major allocation, being amongst those poised to lose most. Though I appreciate its equal weight strategy, smart beta is unlikely to protect its NAV in case tech bulls continue retreating. Microsoft (MSFT) optimists have recently moved up a gear, but I am still skeptical of the broad tech sector returning to the green soon.
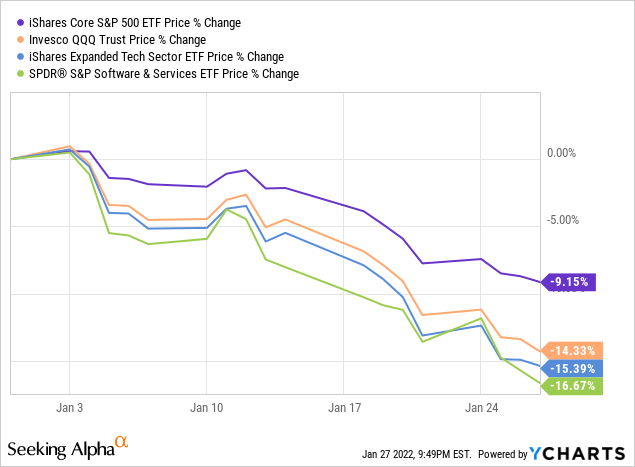
XSW’s price has declined ~16% year-to-date after only a high-single-digit return in 2021. Although this might look like a multi-year buying opportunity, value, GARP, and quality-oriented investors should give this fund a pass at these levels.
Investment strategy
The ETF’s investment mandate is to track the S&P Software & Services Select Industry Index. The benchmark is essentially the fraction of the S&P TMI, with the companies operating in the following industries being eligible:
- Application Software,
- Data Processing & Outsourced Services,
- Interactive Home Entertainment,
- IT Consulting & Other Services,
- Systems Software.
The index uses the modified equal-weight approach. The market cap and liquidity requirements are detailed on page 255 of the prospectus.
Holdings. Factor exposure
As of January 25, XSW oversaw a portfolio of 201 stocks, with the top ten group accounting for around ~6.8% of the net assets. Approximately 5.5% of the holdings are mega-caps, including MSFT with its ~0.49% weight. At the same time, the SPDR ETF is heavily invested in the lower echelons of the equity market, with 63.4% of funds deployed to mid-/small-caps.
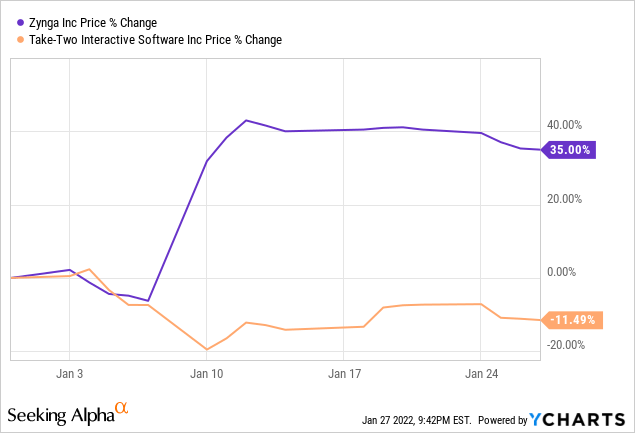
Zynga (ZNGA), a mid-cap social game services provider, is, for now, its main investment, with a weight of around 0.82%. The reason for ZNGA climbing to the top spot is rather prosaic: its share price has risen meteorically this year, defying the gravity of the monetary policy concerns and the tech sector sell-off. The catalyst was its acquisition by Take-Two Interactive (TTWO), the famous GTA franchise maker; it goes without saying that upon closure, ZNGA will disappear from the XSW portfolio. TTWO is also amongst the holdings, though with a smaller weight of around 0.6% and far less spectacular performance in 2022, as the share price has declined by around 11.5%.

Valuation
My analysis of the Quant data illustrated that around 19% of the XSW holdings do have comfortable multiples; that’s a surprisingly large level for a tech fund focusing on longer-duration equities. In my view, that’s mostly the consequence of its smart-beta methodology that engendered larger exposure to small-size companies and trimmed weights of richly valued large caps.
Still, around 44% of the holdings are valued terribly, with grades of D+ or worse.
Among the XSW constituents with Valuation grades from A+ to B- only one player is in the mega-cap club, International Business Machines (IBM), with an A- grade. Splunk (SPLK) is technically the only large-cap. The remaining 36 companies are either mid- or small-caps.
The corollary here is that in case the index XSW tracks used the conventional market-cap weighting, the share of value players would be in single digits. I have created a simple model where XSW holdings are market-cap-weighted (with no adjustments for free float). In this scenario, the share of undervalued stocks goes to as low as ~3.3%.
Quality
XSW’s exposure to quality stocks has surprised me to the downside.
First, only ~50.5% have Quant Profitability grades of at least B-. I prefer to see no less than 80%. Second, over 49% were unable to deliver even measly net profit in the last twelve months. Of course, the net loss might make a misleading impression, especially in case it was caused by one-off items, and other profitability metrics must be taken into account.
But they are lackluster as well. Dozens of companies (72 stocks) were unable to eke out even marginal EBITDA in the last twelve months. Close to 15% outspent the net operating cash flows. Around a fifth was incapable of covering capital expenditures, like Kyndryl (KD) with its FCF to equity of $(1.3) billion on ~$19 billion revenues. Another example is Sabre (SABR), a software & technology solutions provider for the travel industry. SABR has ~$(639) million FCFE on revenues of $1.5 billion and net debt of $3.7 billion.
Of course, for most XSW holdings this inability to cover costs is the direct consequence of hefty research & development expenses typical for IT and communications, especially early-stage players. For instance, SentinelOne (S), a cybersecurity provider, spent 62% of its Q3 revenue on R&D and subsequently failed to deliver a positive operating income.
Growth
Though 30% of the XSW portfolio is allocated to growth stocks like Q2 Holdings (QTWO), the share of those with tepid (or even negative) revenue/net income/cash flow/etc. growth rates is also significant, ~34.3%. So I would not call it an appealing pick for tech growth bulls.
Final thoughts
From October 2011 to December 2021, XSW delivered a close to 21.5% compound annual growth rate, slightly lagging the tech bellwether cohort Invesco QQQ ETF (QQQ); XSW’s larger expense ratio (35 bps vs. QQQ’s 20 bps) is more likely to blame. Anyway, it still trounced the S&P 500 (IVV) easily.

IVV, QQQ, XSW CAGRs
Portfolio Visualizer
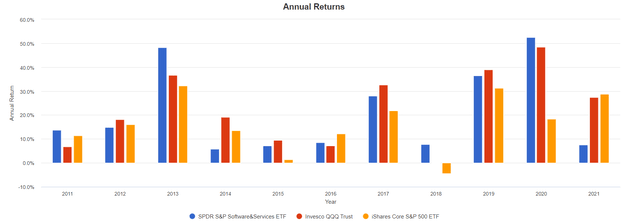
With the tailwinds supporting so-called pandemic winners, the fund posted its strongest annual return in 2020, followed by lackluster 2021 as the mid-cap expensive and low-quality tech suffered from capital rotation to cyclicals. This resulted in XSW underperforming QQQ and IVV grossly as both benefitted from the robustness of the tech behemoths like Apple (AAPL) and Google (GOOG) absent in the XSW portfolio.

IVV, QQQ, XSW annual returns
Portfolio Visualizer
2022 to date has been a sheer calamity for its holdings, as just a handful of stocks it has exposure to have delivered above-zero returns, including Activision Blizzard (ATVI) and ZNGA which enjoyed impressive gains bolstered by announced acquisitions. As a consequence, it has the weakest return compared to iShares Expanded Tech Sector ETF (IGM), QQQ, and IVV.

January 26 and 27 offered relief for tech investors, as Microsoft bulls were buying exultantly, impressed by its profit beat; this certainly had a measly effect on XSW’s NAV considering MSFT’s sub-1% weight in the equity basket vs. over 10% in QQQ.
Overall, given a precarious mix of expensiveness and shaky quality, I am skeptical of the fund as a long idea at the current levels.
[ad_2]
Source links Google News

