[ad_1]
syahrir maulana/iStock via Getty Images
Investment Thesis
Many investors turn to small-cap value ETFs as a way to diversify their portfolios and profit from the market’s preference for value over growth stocks. However, rather than focus on size and style, lately, I’ve been promoting profitability and quality as a means of surviving what could be a significant market downturn ahead. To illustrate how different small-cap value ETFs can be, I’ve decided to compare the Invesco S&P SmallCap Value with Momentum ETF (XSVM) with the iShares S&P Small-Cap 600 Value ETF (IJS). The names suggest the primary difference is the momentum factor, and I think you’ll enjoy seeing how much a single additional screen can change your fortunes. Today, I’m rating XSVM as a rare but highly volatile buy in the small-cap space, while IJS and others like it remain firmly in the hold category.
IJS vs. XSVM: Comparisons
Strategy
IJS tracks the S&P SmallCap 600 Value Index, which uses three factors to measure value: book value to price ratio, earnings to price ratio, and sales to price ratio. S&P defines the small-cap universe as companies with market capitalizations between $850 million and $3.6 billion. It’s worth noting that this Index is not a Pure Value Index. Instead, it includes a blended basket of stocks (approximately 34% of the total small-cap market capitalization) with growth and value characteristics. S&P Style Indices are rebalanced and reconstituted once per year in December.
XSVM tracks the S&P 600 High Momentum Value Index, which holds 120 stocks of the S&P SmallCap 600 Index with attractive valuations and a momentum overlay. The Index is constructed by first giving all 600 small-cap stocks a value score, with the top 240 passing the first screen. From this group, 96 (80%) are chosen based on their value scores, while 24 (20%) are selected based on momentum. Constituents are weighted based on their value scores, and the Index is rebalanced and reconstituted semi-annually after the close on the third Friday of June and December.
Sector Exposures
The following table highlights the sector exposures for IJS, XSVM, and the SPDR S&P 600 Small-Cap ETF (SLY). An alternative to SLY is the iShares Core S&P Small-Cap ETF (IJR), and an alternative to IJS is the SPDR S&P 600 Small Cap Value ETF (SLYV). These are the same ETFs, just with slight differences in expenses.
Morningstar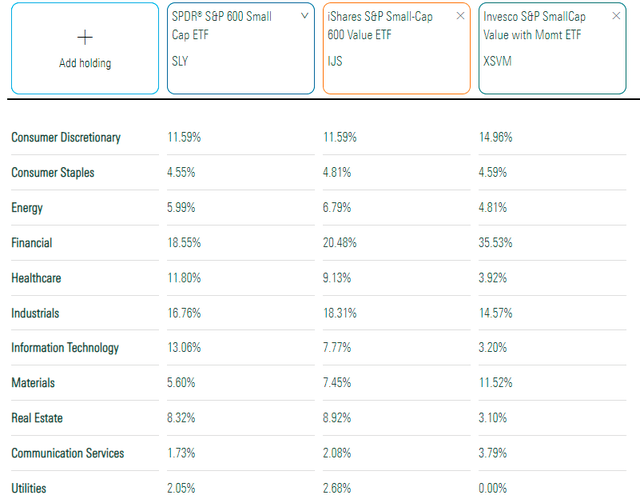
As shown, a key difference is XSVM’s significant exposure (35.53%) to the Financials sector. XSVM also has higher exposure to Consumer Discretionary and Materials stocks but makes up the difference with lower exposures in nearly every other sector. Both ETFs have negligible exposures to the Communication Services, Utilities, and Consumer Staples sectors, so they aren’t for the risk-averse.
Top Ten Holdings
IJS’s top holding is currently cash with a 1.55% weighting, followed by Helmerich & Payne (HP), South Jersey Industries (SJI), and Insight Enterprises (NSIT). Notice how no stock has a high weighting in the small-cap space because there is a cap ($3.6 billion) on how large a company can be before it becomes eligible for the S&P MidCap 400 Index.
iShares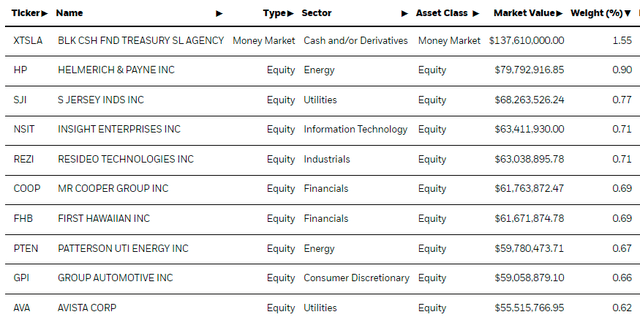
On the other hand, XSVM is more concentrated because it only has 120 holdings. They include Olympic Steel (ZEUS), Rayonier Advanced Materials (RYAM), and The Andersons (ANDE), a small agriculture company that just enjoyed a stellar fourth quarter.
Invesco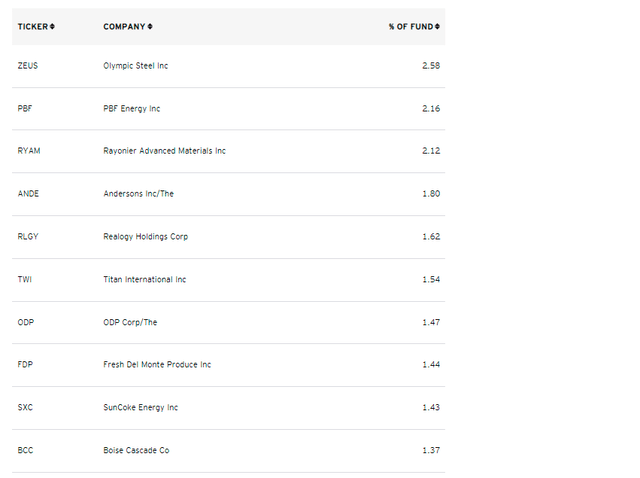
Historical Performance
Examining an ETF’s historical returns gives investors insight into how well a particular strategy performed over time. In the case of IJS and XSVM, a key difference is the momentum factor, so we can judge how valuable that factor was in a largely bullish market. XSVM changed its Index in June 2019, so returns before that date may not be as reliable as I discussed previously. It used to track the Russell 2000 Pure Value Index, which, unfortunately, no ETF tracks anymore. However, the graph below includes the Invesco S&P SmallCap 600 Pure Value ETF (RZV) performance, a fair substitute.
Portfolio Visualizer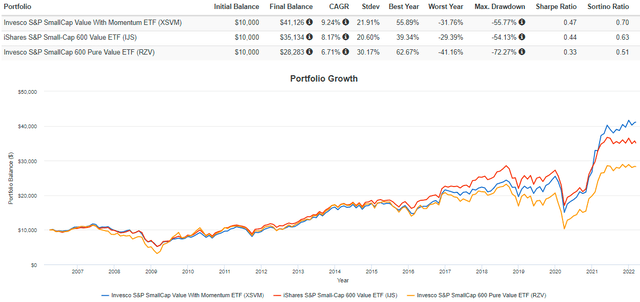
As shown, XSVM’s returns since January 2006 were 1.07% more per year better than IJS and 2.53% per year better than RZV. However, XSVM’s excess returns happened when the Index changed. A look at rolling three-year returns makes this more evident. Through February 2022, XSVM’s annualized three-year returns were 21.95%, nearly double that of IJS and RZV.
Portfolio Visualizer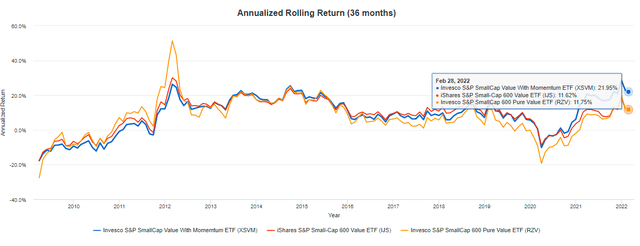
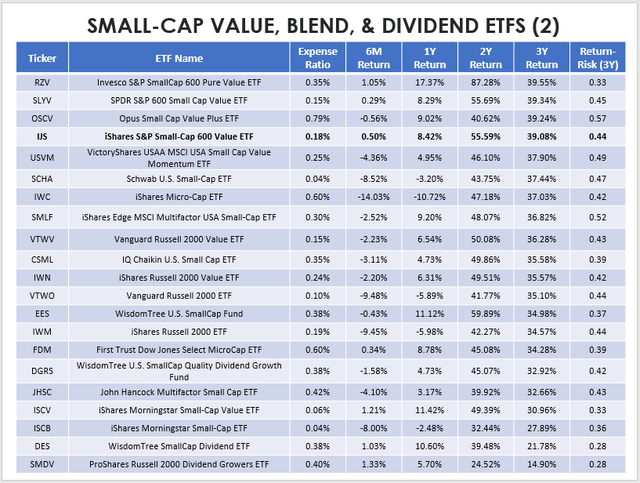
Before continuing, I want to discuss alternatives to both ETFs briefly. In my ETF Database, I’ve placed XSVM and IJS in the small-cap value category, consistent with FactSet’s system, but some blended and dividend ETFs are worth considering, too. Here is a table of historical returns through February 2022 in order of best to worst over the last three years. I have included those with at least a three-year history and over $100 million in AUM. You can see that XSVM’s returns and risk-adjusted returns were the best, no matter the category. Since blended ETFs include growth stocks, which had an advantage over the last three years, XSVM’s performance is impressive.
Author Author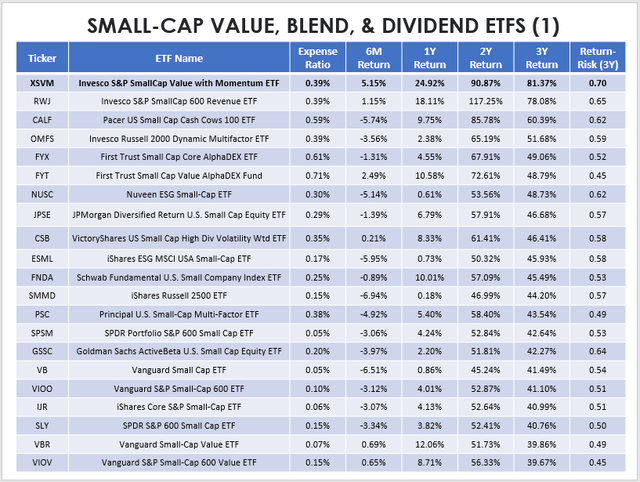
ETF Analysis
In my view, the past performance of ETFs becomes less reliable should the basket of stocks substantially change or if the environment changes, which I believe is the case today. In these cases, taking a closer look at the fundamentals of the two ETFs is prudent. I’ve calculated metrics for IJS’s top 20 industries below, which total 49%. This way, we can see that most of IJS’s Financials exposure is in Regional Banks (10.89%). Other industries, like Thrifts & Mortgage Finance (2.39%) and Mortgage REITs (2.16%), have minimal weight, so generally, IJS is a fairly well-diversified fund.
Author Using Data From Seeking Alpha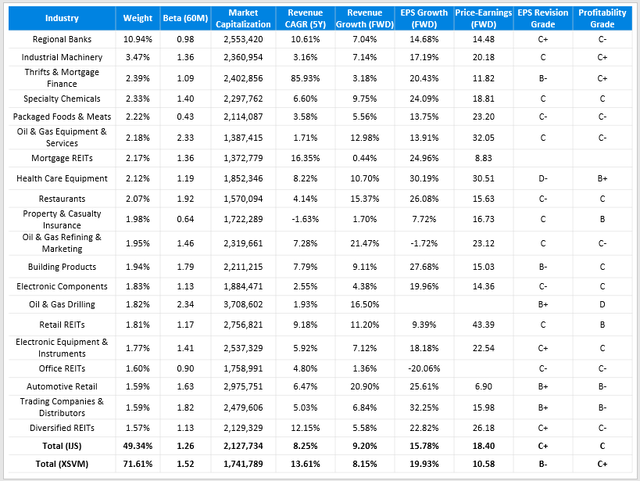
The bottom two rows summarize both ETF’s metrics on volatility, market capitalization, growth, valuation, and profitability. As shown, XSVM leads in almost every category, including a more substantial five-year revenue growth rate (13.61% vs. 8.25%), a higher estimated EPS growth rate (19.93% vs. 15.78%), a lower forward P/E (10.58 vs. 18.40), and better EPS Revisions and Profitability Grades as determined by Seeking Alpha. The standout figure is the P/E, which is among the lowest for all small-cap ETFs. The market has favored low P/E stocks this year, and I think so long as sentiment wanes and uncertainty increases, there is a good chance this trend will continue. The table above also reveals three disadvantages for XSVM:
- higher concentration among the top 20 industries (71.61% vs. 49.34%)
- higher five-year beta (1.52 vs. 1.26)
- lower one-year forward revenue growth rate (8.15% vs. 9.20%)
The first two points are why XSVM should not be your only small-cap ETF. It’s aggressive and highly sensitive to market changes, and in a time when many investors are looking to de-risk their portfolios, XSVM would likely do the opposite. As for the lower revenue growth rate, I believe it reflects the types of securities XSVM holds, specifically those in the regional bank and mortgage REITs industries. XSVM is overweight 7.69% in regional banks and 5.14% in mortgage REITs, and the flattening yield curve has negatively impacted both industries this year.
St. Louis Federal Reserve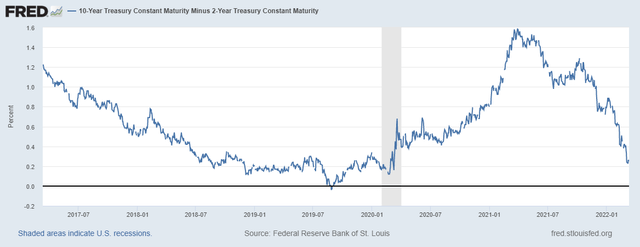
Regional banks should earn higher margins from rising rates, but the pace of increases could be a net negative should economic growth be stunted. To illustrate, the iShares U.S. Regional Banks ETF (IAT) lost 64.41% during the Subprime Crisis from November 2007 to March 2009. IAT also fell 42.74% in Q1 2020, so the potential for huge losses exist should the economy find itself on shaky footing.
As for mortgage REITs, most exposure is in agency mREITs or commercial mREITs, both of which are highly sensitive to interest rate changes. When the yield spread rose in the first half of 2021, the VanEck Mortgage REIT Income ETF (MORT) did quite well, gaining 20.56%. However, MORT has dropped 13.26% since, coinciding with the flattening yield curve graph above. In this case, XSVM’s momentum factor might end up being a drag.
If you’re wondering what industries have the most momentum right now, perhaps the table below will be helpful. It highlights a variety of price metrics for XSVM’s top 20 industries, which total 71.61% of the ETF.
Author Using Data From Seeking Alpha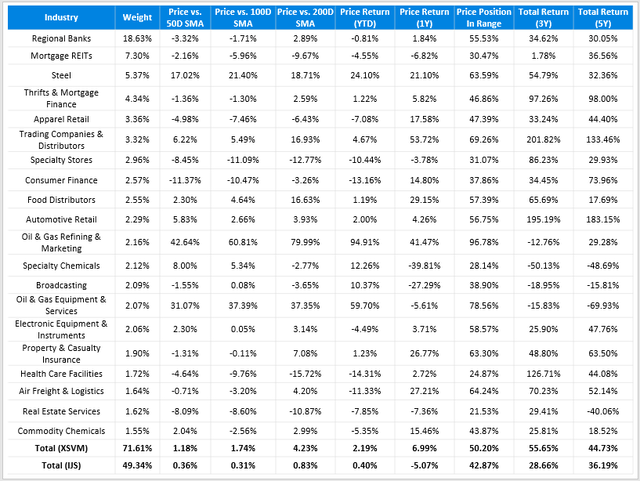
Looking at the bottom two rows, it’s clear XSVM’s current holdings have been better performers over every period, suggesting the momentum factor works. However, I want to remind readers what I found the last time I reviewed XSVM. From August 2011 to June 2019, the S&P SmallCap 600 High Momentum Value Index had only a slight advantage over the Value Index. Given its high beta, it might be more appropriate to invest based on the fundamentals, which may change substantially each reconstitution, rather than the overall strategy.
- S&P SmallCap 600 High Momentum Value Index: 11.77%
- S&P SmallCap 600 Value Index: 11.59%
- S&P SmallCap 600 Growth Index: 12.84%
- S&P SmallCap 600 Index: 12.21%
Digging a little deeper, the table above also reveals weak one-year price performances in Mortgage REITs, Specialty Stores, Specialty Chemicals, and Broadcasting. In contrast, Steel stocks like SunCoke Energy (SXC) and TimkenSteel (TMST) have enjoyed spectacular years. I point this out because both strong- and weak-performing stocks are at risk of being eliminated in the June reconstitution for either a value or momentum-related reason. XSVM’s annual portfolio turnover rate in 2020 and 2021 was 128% and 78%, so investors should expect a different-looking portfolio come late June. That could make this analysis obsolete and leave you with a highly-volatile portfolio that wouldn’t have benefitted investors, at least from 2011 to 2019.
Investment Recommendation
I’m rating XSVM as a buy, albeit a temporary one, while I’m somewhere between bearish and neutral on IJS. The primary reasons are that XSVM’s forward P/E ratio is substantially lower (10.58 vs. 18.40), and its constituents have slightly better profitability levels. I think the large allocation to regional banks and mortgage REITs will be a net positive, but that’s on the assumption that interest rates won’t rise too quickly enough to hurt the economy. It’s also assuming industry allocations will remain somewhat the same after the June reconstitution. History shows this isn’t guaranteed, so XSVM might be better for traders rather than long-term investors. Investors need to look past XSVM’s stellar recent performance and keep in mind that from 2011 to 2019, the underlying Index failed to outperform the small-cap value segment.
As for IJS, I can’t justify paying 18.40x forward earnings for a group of stocks with a “C” Profitability Grade. One benefit of tracking 800+ U.S. Equity ETFs is that I can quickly assess the strength of the alternatives. The fact is that most large-cap value ETFs are much less volatile and much more profitable with comparable valuations. IJS doesn’t make any sense right now, hence my rating. Thank you for reading, and I look forward to providing updates on both ETFs as the market environment changes.
[ad_2]
Source links Google News

