[ad_1]
ETF Overview
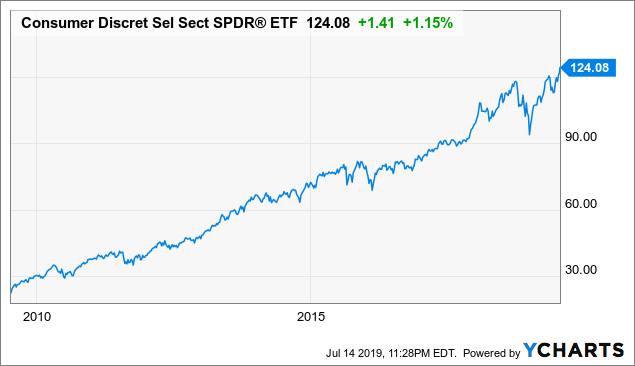
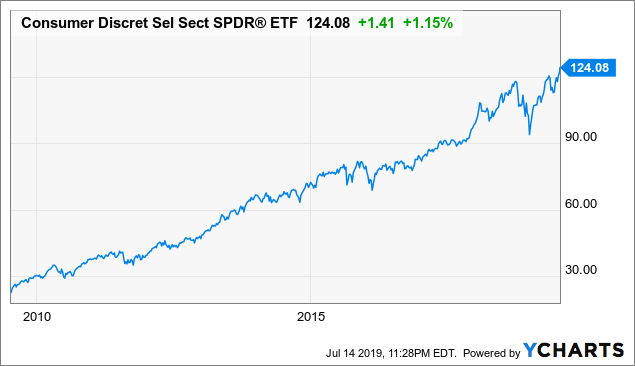
The Consumer Discretionary Select Sector SPDR ETF (XLY) owns a portfolio of U.S. large-cap stocks in the consumer discretionary sector. The ETF basically tracks the consumer discretionary stocks in the S&P 500 Index. XLY has outperformed the S&P 500 Index in the past 10 years and is currently trading at a premium to the S&P 500 Index. XLY’s portfolio of stocks is mostly e-commerce resilient. Its largest holding, Amazon (NASDAQ:AMZN), also should enjoy the tailwind of the rise of e-commerce in the next few years. We think XLY is a good ETF to hold on to as long as this economic cycle continues.
Data by YCharts
Fund Analysis
High exposure to e-commerce
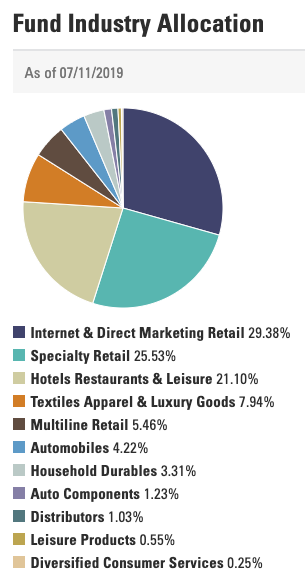
Consumer discretionary sector consists of a wide range of subsectors. As can be seen from the fund’s industry allocation, XLY’s allocation include textile apparel and luxury goods, internet and direct marketing retail, special retail, multiline retail, automobiles, household durables, hotels restaurants and leisure, etc.
Source: SPDR Website
As can be seen from the chart above, internet and direct marketing retail represents 29.4% of XLY’s portfolio. Its largest holding, Amazon, which represents 23.7% of the total portfolio, is part of this subsector. The rise of e-commerce and significant growth in Amazon’s business has helped Amazon’s share price to surge by 466% in the past 5 years. Amazon’s stock performance is one of the primary drivers of XLY’s fund performance. Looking forward, we continue to believe this growth will continue as more and more consumers shop online and use various services on the Internet. Below is a chart that shows projected retail e-commerce sales in the U.S. through 2023. As can be seen, U.S. retail e-commerce sales is expected to grow from $560.7 billion in 2019 to $735.4 billion in 2023. This will be a growth rate of 31.2% in 4 years. Therefore, we continue to expect strong growth in its e-commerce stocks in the portfolio.
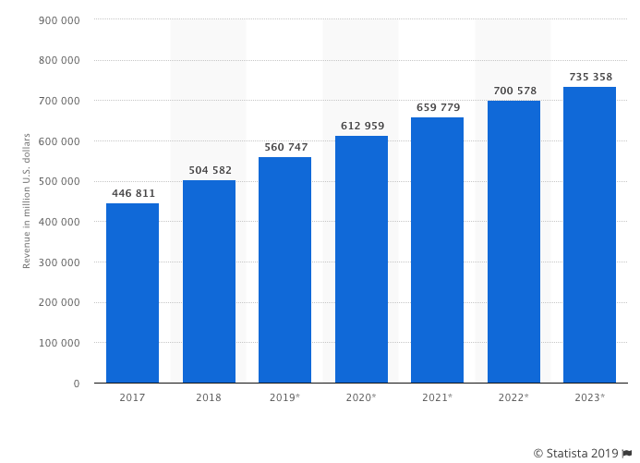
Retail e-commerce sales in the U.S. (Source: Statista 2019)
Besides XLY’s exposure to e-commerce, most of its other subsectors are resilient to the rise of e-commerce. Subsectors such as specialty retail (25.5% of its portfolio), hotels restaurants and leisure (21.1%), automobile (4.2%), and household durables (3.3%) have characteristics that insulate them from the threat of e-commerce. These subsectors represent 54.1% of XLY’s portfolio. Together with its 29.4% exposure to internet and direct marketing retail, XLY’s portfolio are either e-commerce resilient or will be able to take advantage of the rapid growth in e-commerce.
U.S. consumer confidence level still robust
U.S. consumer confidence remains at a high level. As can be seen from the chart below, its consumer confidence index of 98.2 in June 2019 is near the highest we have seen in this economic cycle.
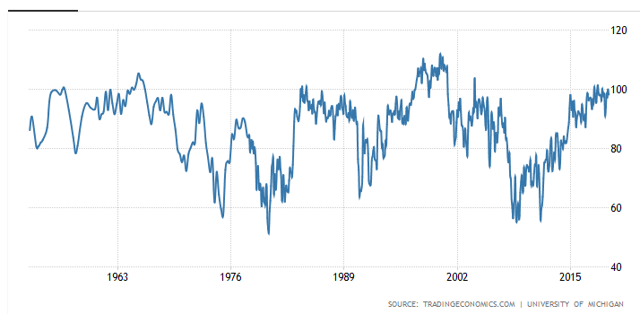
Source: Trading Economics: U.S. Consumer Confidence
We believe this high confidence level is well-supported by a low unemployment rate of 3.7% in June 2019. In addition, wage growth has re-accelerated in the past few months. As can be seen from the chart below, wage growth rate of 3.59% in May 2019 was better than the 3.47% in the beginning of the year. In this environment, we think XLY’s portfolio of stocks will continue to do well.
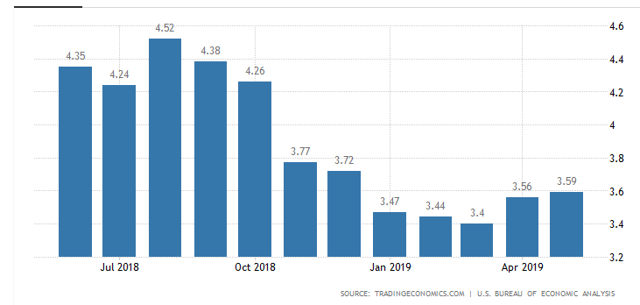
Source: Trading Economics: U.S. Wage Growth
XLY appears to be more expensive than S&P 500 Index
XLY’s portfolio of stocks has an average forward P/E ratio of 20.98x. This is more than 3x multiples higher than S&P 500 Index’s 17.82x. Its average price to cash flow ratio of 11.22x is also nearly 2 multiple higher than S&P 500 Index’s 9.26x.
|
XLY |
S&P 500 Index |
|
|
Forward P/E Ratio |
20.98x |
17.82X |
|
Dividend Yield (%) |
1.46% |
2.00% |
|
Sales Growth (%) |
7.87% |
7.12% |
|
Cash Flow Growth (%) |
15.22% |
13.37% |
|
Price to Cash Flow Ratio |
11.22x |
9.26x |
Source: Morningstar, Created by author
Based on the table above, XLY appears to be more expensive than S&P 500 Index but with slightly better growth. However, this is not surprising as XLY’s fund performance exceeded S&P 500 Index. As can be seen from the charts below, XLY’s fund value grew by 452% in 10 years. This is much better than S&P 500 Index’s 234%. XLY’s total return (including dividends) of 540% also outpaced S&P 500 Index’s 308%.
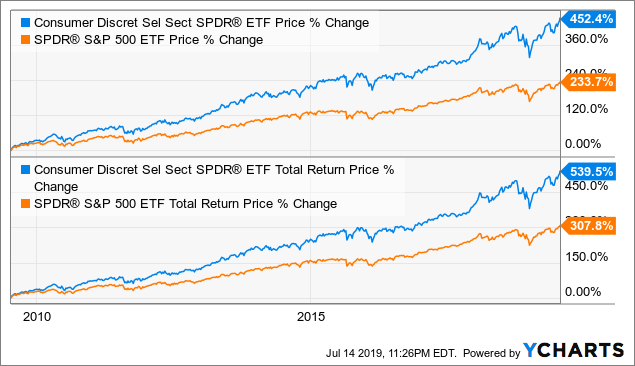
Data by YCharts
Risks and Challenges
These stocks have sizable businesses oversea
Although stocks in XLY’s portfolio are large-cap U.S. stocks, many of these stocks have sizable businesses overseas. Companies such as Nike (NKE), Starbucks (SBUX), McDonald’s (MCD), General Motors (GM) derives a significant portion of their revenues outside of the U.S. As can be seen from the chart below, global consumer confidence index appears to be on a downward trend since the beginning of 2018. These companies may experience a slowdown in their revenue growth if the global economy continues to decelerate.
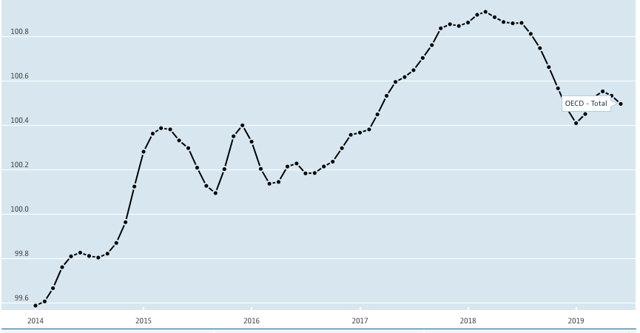
Global Consumer Confidence Index (Source: OECD Data)
Investor Takeaway
We like XLY’s portfolio of stocks that are mostly resilient to the threat of e-commerce. In addition, it also has a good exposure to e-commerce. Given the strong consumer confidence level in the U.S., XLY appears to be a good ETF to hold on to. However, investors should continue to monitor key metrics such as U.S. consumer confidence index and wage growth to gauge the health of the economy.
Disclosure: I/we have no positions in any stocks mentioned, and no plans to initiate any positions within the next 72 hours. I wrote this article myself, and it expresses my own opinions. I am not receiving compensation for it (other than from Seeking Alpha). I have no business relationship with any company whose stock is mentioned in this article.
Additional disclosure: This is not financial advice and that all financial investments carry risks. Investors are expected to seek financial advice from professionals before making any investment.
[ad_2]
Source link Google News

