[ad_1]

ArtistGNDphotography
Whether it is a casual or some long-distance relationship, technology and oil seem to be linked to each other. Only nine years back, it was energy stocks such as Exxon Mobil (XOM) which were the most valued public-listed companies, but today, it is tech names like Apple (NASDAQ:AAPL). Exxon’s market cap has been rapidly making for lost ground, but, my aim with this thesis is not to convince you that energy names will make a comeback or tech will prevail. Instead, it is to exploit the inverse correlation between these two energy sectors, not only to make money but also to preserve capital.
This relationship is illustrated by the blue chart of the Technology Select Sector SPDR ETF (NYSEARCA:XLK) moving inversely to the Energy Select Sector SPDR ETF (NYSEARCA:XLE) over the last one-year period.
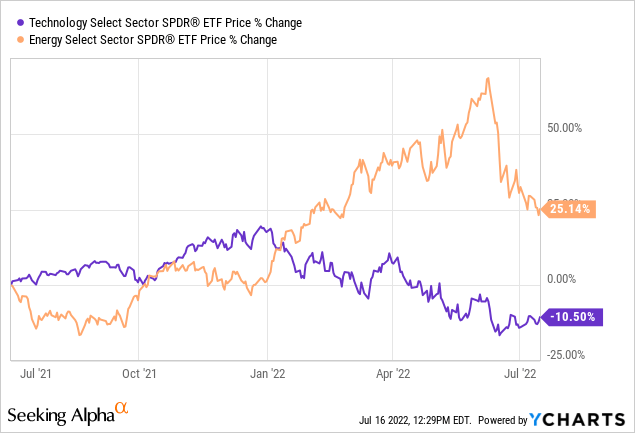
Before coming to the nitty gritty of the investment aspect, I provide some perspectives as to how the performances of the tech and energy sectors are related to each other.
Inversely Correlated Tech and Energy Sectors
Starting with XLK, in addition to Apple, it holds some of the largest companies coming from the IT hardware, software, and semiconductor industries as shown in the figure below. These companies are different in terms of the sphere of business activities they are involved in. Still, as tech companies, they have been victims of volatility caused by an acceleration of inflation which has, in turn, resulted in a more hawkish stance by the Federal Reserve.
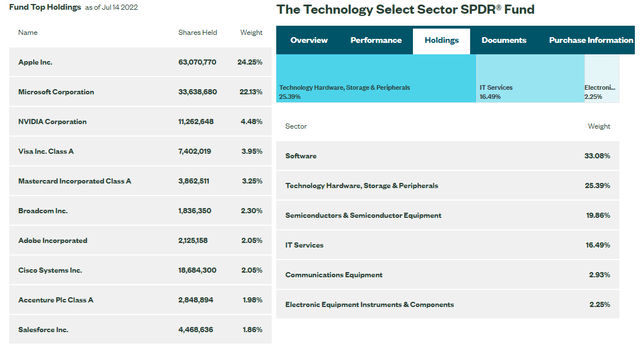
XLK’s holdings and sectors (SSGA)
Now, tech stocks are particularly sensitive to rising rates as their value is determined by their forward earnings or the profits they are expected to generate in the coming years. With rates moving higher, borrowing costs also escalate making it more challenging to generate expected returns in the future, and thus, there is less enthusiasm for investing in technology as risk premiums rise and potential payoffs become more uncertain. At the same time, with higher interest rates, safer U.S. government bonds become more attractive.
Well, this is not entirely true as evidenced by the -25% year-to-date performance of the Vanguard Extended Duration Treasury ETF (EDV) in the orange chart below. For this matter, government bonds have largely failed to deliver as a hedge against the market downturn. Instead, XLE’s 19.87% gains show that it is energy that has been benefiting from investors’ enthusiasm.
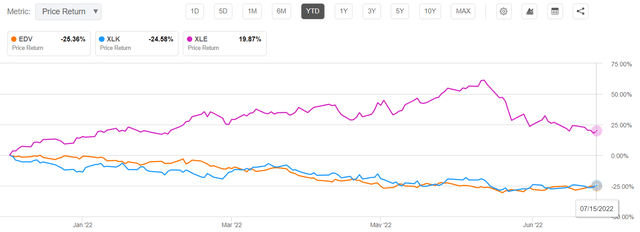
Comparison of performances EDV, XLK, XLE (Seeking Alpha)
This overperformance of the energy ETF has largely been dictated by the price of crude oil, which has inexorably moved higher, appreciating by more than 50% since August 2021.
Volatility around demand and supply and oil
In this respect, with energy constituting the underlying raw material for many sectors like thermal power generation and transportation, rising energy costs have translated into higher prices of goods and services throughout the economy, resulting not only in high inflation but also augmented recession risks. Consequently, the top five oil stocks held by XLE have suffered from -11% to -23% downsides. As a result, the ETF’s NAV fell by 16.88%.
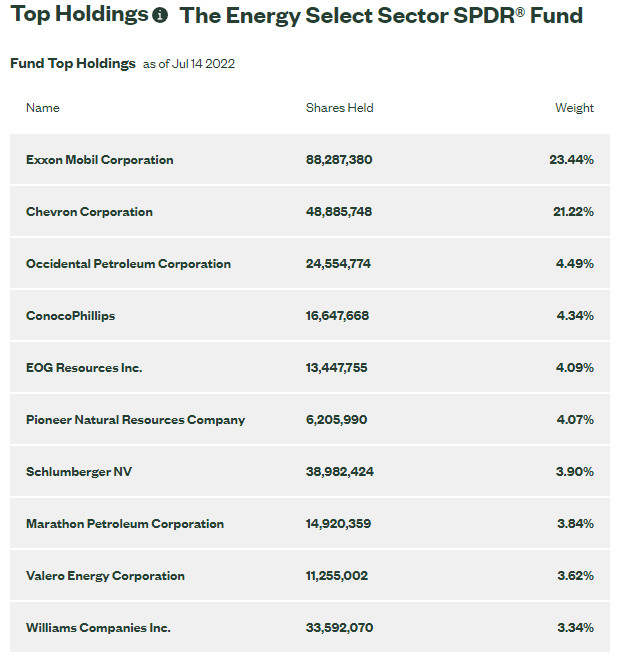
XLE’s holdings (SSGA)
However, oil stocks recouped part of their losses on Friday 15 with Occidental Petroleum (OXY) climbing by 2.59% following a report that Saudi Arabia which is OPEC’s (Organization of the Petroleum Exporting Countries) main contributor may not be able to increase oil production in the short term as initially expected. This in turn means less supply to the world market and led to the West Texas Intermediate crude appreciating by 1.89%.
Still, uncertainties remain as the pandemic is not yet over.
In this respect, in addition to the eventuality of an economic slowdown that can grind the demand for oil, Covid-related lockdowns in China negatively impact people’s ability to travel or meet their friends or shuttle to work. Moreover, with infection rates from the new variants being on the rise in some parts of the world despite vaccinations, it is not inconceivable that there may be more movement restricting mandates, which can adversely impact oil demand.
Devising the Investment Strategy
Now, learning from the first wave of the pandemic, people spent more time on their sofas, either working remotely on their laptops or playing games on consoles. Additionally, there was higher consumption of apps from the App store or online entertainment, while companies accelerated digital transformation. It is unlikely that this secular digitalization trend will end anytime soon, which augurs well for tech stocks, especially at times of pain for the physical economy which encompasses travel and transportation.
In these circumstances, after a 24.58% downside as shown in the above chart, XLK has started to look attractive, but, far from advising investors to sell oil stocks and buy tech names, the aim is rather to own both ETFs. In this case, assuming an investment of $1000 in XLK and $1000 in XLE respectively, historical performance indicates that an investment made for a period of nine months is profitable as shaded in green below. The same is the case for a one-year, three-year, and five-year time frame. In all other cases, the net amount obtained is less than $2000, resulting in a loss, as shaded in red.
Nevertheless, investors will note that even in the worst-case scenario, which is the three-month period, an investor still retains 88.1% of the initial amount invested which is not bad given these highly volatile times.

Gain on $2000 ($1000 invested in XLK and $1000 in XLE) – with table built using data from (Seeking Alpha)
Extrapolating further, an investment of $1000 on XLK and $2000 on XLE as shown in the table below, goes a step further in preserving capital as there are only three rows shaded in red. Also, the gains are more uniformly distributed across the nine-month to five-year time periods.
Thinking aloud, investors can also opt for other ratios instead of the 1000:1000 or 1000:2000 I have used in the two examples.

Gain on $3000 ($1000 invested in XLK and $2000 in XLE) with table built using data from (Seeking Alpha)
It is also to be noted that these gains or losses do not include commissions or other fees normally charged by brokers.
Concluding with Risks and Total Returns
Therefore, it is possible to invest in the inverse correlation to make money while at the same time benefitting from a high degree (percentage) of capital preservation. This said both scenarios are based on historical performance which may not be repeated in the future, thereby resulting in more capital losses than anticipated.
Additionally, there are risks that due to highly adverse market conditions, both tech and energy stocks suffer from severe downturns as was the case in March 2020 when the first wave of the pandemic struck. This is precisely the reason why this is a long-term investment strategy instead of short-term trading. This is also not pair-trading where you are bullish on one ETF and bearish on the other, but rather one where you are invested in both at the same time, and weakness in one sector is compensated by strength in the other. This is why I have a hold position on both ETFs.
Furthermore, given that more capital expenses are required in this case than for investing in a single stock, this strategy can also be used for portfolio diversification purposes. For example, it is suitable for those who are already invested in tech and want to add energy to their portfolio, or vice versa.
Continuing on a positive note, with expense ratios of 0.10% and total assets under management of $39.4 billion and $31.83 billion for XLK and XLE respectively, these are highly popular ETFs that hold some of the stocks with the highest market capitalizations. As such, despite being subject to abrupt market fluctuations, they are more immune to systemic risks than smaller companies.
Along the same lines, this investment strategy becomes more attractive when considering dividend payments that are not included in the gains shown in the above tables. To remediate this and as depicted in the charts below, I consider the total returns which include both the price performance plus dividend payments in case these are reinvested. Thus, for the year-to-date period (or from the start of 2022), the difference between the total and price returns is 2.46% (26.05-23.59) for XLE and 0.33% (23.86-23.53) for XLK.
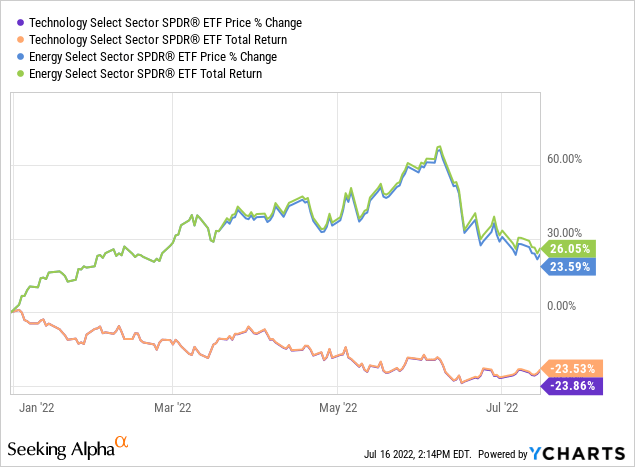
These differences are sizeable enough to tilt an investment towards a gain for the $2000 year-to-date investment, as well as increase the chances of capital preservation for other periods.
Finally, considering returns and risks, it makes sense to pursue an investment strategy based on two ETFs that are inversely correlated to each other, but remember that it is also important to adopt a long-term posture.
[ad_2]
Source links Google News

