[ad_1]

fazon1/iStock Editorial via Getty Images
In the old Roadrunner cartoons, Wile E. Coyote would often find himself having run off the edge of a cliff but not actually falling until he realized that he was no longer on solid ground. Not many people know that, just as Mickey Mouse evolved from the character Mortimer Mouse, Wile E. Coyote’s origins lie in a character from the 1920s called Wall St. Coyote.
Wall St. Coyote’s gag was that, after having chased returns off the edge of a New York skyscraper, he would, like his later roadrunner-chasing reincarnation, realize he was no longer on terra firma, drop, and then, on the way down, calculate how high he was likely to bounce as he hit each ledge along the way. His underlying assumption was that he would return to his previous highs, and so with each ledge that he hit, he would become more and more excited, no matter how badly bruised and broken he became with each new low.
By 1929, the character was hugely popular, with kids begging their bob-headed mothers and dandified fathers to buy them Wall St. Coyote’s signature straw hats and other such memorabilia. But, by 1931, the public had turned against Wall St. Coyote, and he was retired to the American Southwest to be rebranded. By then, he had learned that once he had been outwitted by his prey, he would just have to wait until he hit rock bottom before starting all over again.
Over the last six months or so, the Communication Services Select Sector SPDR Fund (XLC) has consistently been the worst-performing of the major sector indices, and yet I often read comments about how the increasingly poor performance of these stocks means that they are “cheap” and have just that much more upside potential.

For XLC holders, a mirror? (Financial Times)
Of course, these optimists may be proven right. Not only will there be the inevitable dead-coyote bounces along the way, but markets, in the end, do what they are going to do. They do not move in straight lines. They have their own logic, and physical principles like gravity make for very loose metaphors (we will have to find out about cartoons).
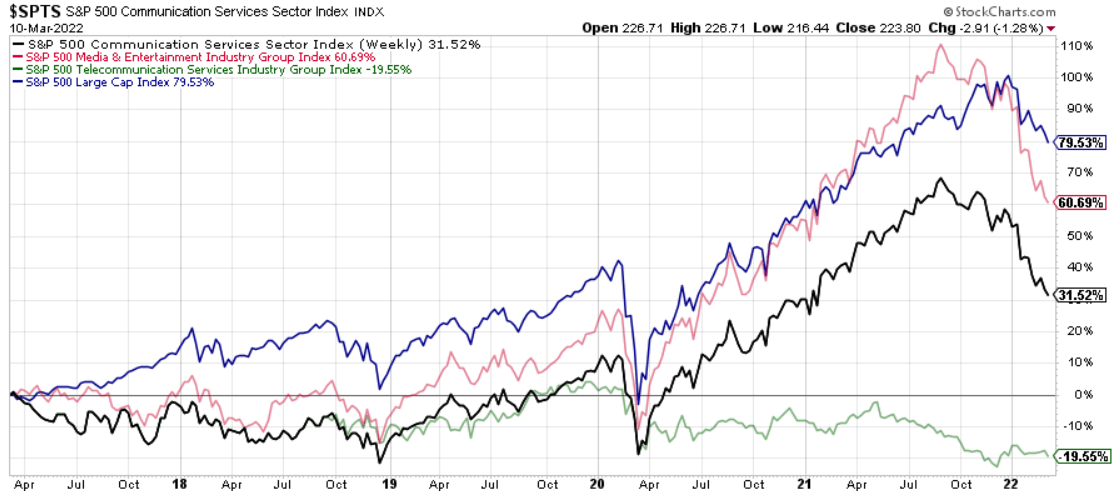
Chart A. Communication Services stocks had been held aloft by Media & Entertainment stocks (Stockcharts.com)
Nevertheless, I will argue that, whatever bounces XLC and its constituents may experience in the coming months, the sector likely has much farther to fall and will likely not begin a real turnaround until the end of the decade. For a more general outlook on tech stocks, you can visit my article Big Tech Has A Lot Farther To Fall, but in this piece I am going to focus on the XLC and its components.
As I have done with recent pieces on industrials (XLI), basic materials (XLB), energy (XLE), and brokerages (IAI), I will analyze those components using Fama-French industry data going back to 1926. That data, or rather my interpretation of it, suggests that XLC valuations have been unsustainable (“overvalued”, if you like) and the result has typically been depressed returns.
Chart A, above, shows price indexes for the S&P 500, the Communication Services Sector Index, and the two industry groups that comprise the sector, the Media & Entertainment Industry Group and the Telecommunication Services Industry Group. Telecommunications companies have struggled since 2019 and, somewhat surprisingly, never recovered during the pandemic. The Media & Entertainment group outperformed the S&P 500 and clearly made up for the weakness in telecommunications.
Although each of the sector indexes that we have covered in recent weeks contains a variety of industry and industry groups, there is considerably more divergence here, and this makes it difficult to focus on a core grouping.
Companies in the S&P 500 are placed in one of the eleven sectors depending on their GICS codes, which are regularly updated and adjusted depending on a host of financial criteria. This article explains some of the differences between the variety of classifications, but the advantage of the Fama-French SIC groupings is that they allow us to look back farther than do other classifications.
The following table shows XLC’s holdings, weights, and GICS classification, alongside each company’s Fama-French 49-industry classifications.
|
The Communication Services Select Sector SPDR® Fund holdings as of 09-Mar-2022 |
||||||
|
Name |
Ticker |
Weight |
Cumulative weight |
GICS Sector |
FF49 Industry(own calculations) |
|
|
Meta Platforms Inc. Class A |
FB |
16.0 |
16.0 |
1 |
Interactive Media & Services |
Software |
|
Alphabet Inc. Class A |
GOOGL |
12.4 |
28.5 |
2 |
Interactive Media & Services |
Software |
|
Alphabet Inc. Class C |
GOOG |
11.6 |
40.1 |
3 |
Interactive Media & Services |
Software |
|
Activision Blizzard Inc. |
ATVI |
5.6 |
45.6 |
4 |
Entertainment |
Other* |
|
T-Mobile US Inc. |
TMUS |
5.5 |
51.2 |
5 |
Wireless Telecommunication Services |
Telecom |
|
Verizon Communications Inc. |
VZ |
5.5 |
56.7 |
6 |
Diversified Telecommunication Services |
Telecom |
|
AT&T Inc. |
T |
5.3 |
62.0 |
7 |
Diversified Telecommunication Services |
Telecom |
|
Comcast Corporation Class A |
CMCSA |
5.0 |
67.0 |
8 |
Media |
Telecom |
|
Charter Communications Inc. Class A |
CHTR |
4.8 |
71.7 |
9 |
Media |
Telecom |
|
Walt Disney Company |
DIS |
4.6 |
76.3 |
10 |
Entertainment |
Entertainment |
|
Electronic Arts Inc. |
EA |
3.1 |
79.4 |
11 |
Entertainment |
Other* |
|
Netflix Inc. |
NFLX |
3.1 |
82.5 |
12 |
Entertainment |
Entertainment |
|
Match Group Inc. |
MTCH |
2.5 |
85.0 |
13 |
Interactive Media & Services |
Personal services |
|
Twitter Inc. |
TWTR |
2.4 |
87.4 |
14 |
Interactive Media & Services |
Software |
|
Paramount Global Class B |
PARA |
1.8 |
89.2 |
15 |
Media |
Telecom |
|
Take-Two Interactive Software Inc. |
TTWO |
1.6 |
90.8 |
16 |
Entertainment |
Other* |
|
Omnicom Group Inc |
OMC |
1.4 |
92.3 |
17 |
Media |
Other |
|
Live Nation Entertainment Inc. |
LYV |
1.3 |
93.6 |
18 |
Entertainment |
Entertainment |
|
Interpublic Group of Companies Inc. |
IPG |
1.2 |
94.7 |
19 |
Media |
Business services |
|
Fox Corporation Class A |
FOXA |
1.2 |
95.9 |
20 |
Media |
Telecom |
|
Lumen Technologies Inc. |
LUMN |
0.9 |
96.8 |
21 |
Diversified Telecommunication Services |
Telecom |
|
News Corporation Class A |
NWSA |
0.7 |
97.5 |
22 |
Media |
Printing & Publishing |
|
DISH Network Corporation Class A |
DISH |
0.7 |
98.2 |
23 |
Media |
Telecom |
|
Discovery Inc. Class C |
DISCK |
0.7 |
98.9 |
24 |
Media |
Telecom |
|
Fox Corporation Class B |
FOX |
0.5 |
99.3 |
25 |
Media |
Telecom |
|
Discovery Inc. Class A |
DISCA |
0.4 |
99.7 |
26 |
Media |
Telecom |
|
News Corporation Class B |
NWS |
0.2 |
99.9 |
27 |
Media |
Printing & Publishing |
The table below shows the XLB’s classification structure. From left to right, there are two industry groups divided into a total of five industries, which are then divided into ten subindustries.

XLC is composed of two industry groups (Global Industry Classification Standard – Wikipedia)
And the next one shows the weight by industry.
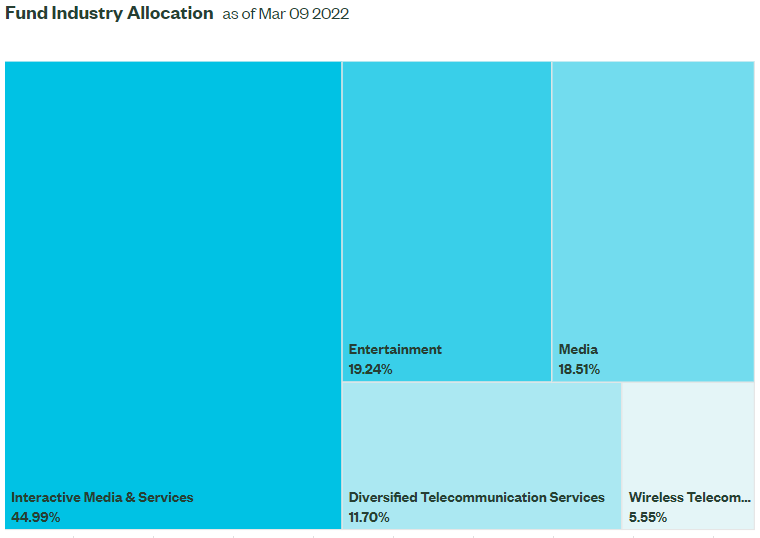
XLC is dominated by the three industries of the Media & Entertainment Group (XLC: The Communication Services Select Sector SPDR® Fund (ssga.com))
The three industries of the Media & Entertainment Group (that is, Interactive Media & Services, Entertainment, and Media) make up the bulk of the index (over 80%). The rest, of course, is Telecommunications Services. The Wireless Telecommunications Services industry is only comprised of one company at the moment, T-Mobile.
The following chart shows the 52-week performances of these industry indexes, ranked by weight (I could not find the Wireless index, so just used T-Mobile instead).
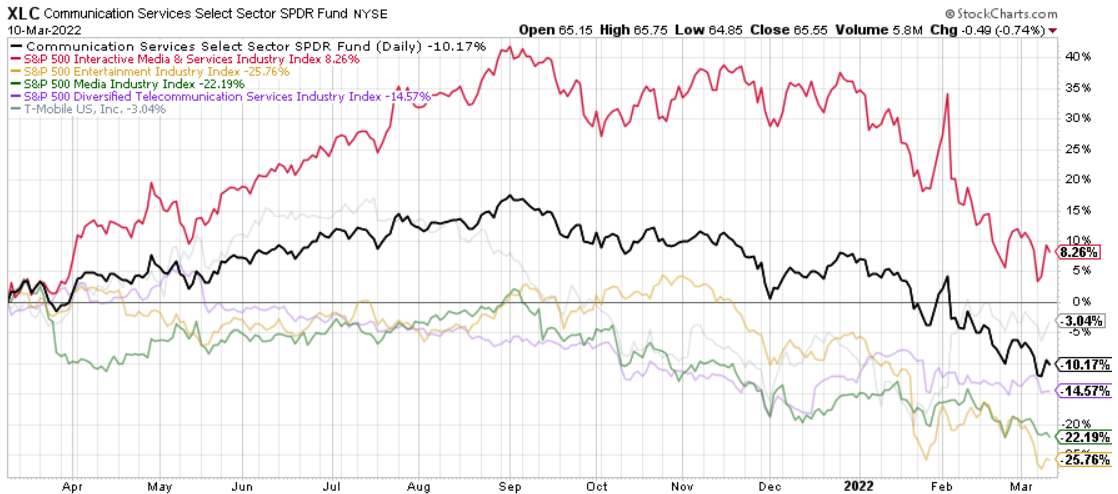
Chart B. The largest industry, Interactive Media & Services, began contributing to the decline at the beginning of the year (Stockcharts.com)
If they diverged during the pandemic, as we saw in Chart A, they are all singing from the same hymnbook now. Each of them is very near its 52-week low. The weakest of these industries (by this measure) have actually been relatively stable the last two months. The weakness in 2022 has come primarily from the Interactive Media & Services Industry’s eagerness to close the gap.
Those are the GICS weightings and performances, but again, for historical context, we need to look at Fama-French SIC data. In the following table, I show the percentage of stocks within the XLC that fit into these Fama-French 49 indexes.
|
FF49 Industry |
XLC % |
|
Software |
42.5 |
|
Telecommunications |
32.2 |
|
Entertainment |
8.9 |
A couple of notes of caution are in order. First, there are companies within the Fama-French indexes that are not within the XLC. For example, Microsoft (MSFT) is a Fama-French Software company, but it is in the Information Technology sector (XLK) rather than XLC, because the GICS methodology sees the company as being more similar to Apple than to Google or Facebook. Second, these three industries account for about 83% of the index. Other Fama-French groupings include Personal Services, Business Services, Printing & Publishing, and Other. In Table 1, I put an asterisk next to those “Other” stocks that would seem to match the “Entertainment” category, primarily video game companies like Activision Blizzard. If those stocks were classified as Entertainment, that would raise the Entertainment weighting from 8.9% to 19.2% and expand coverage to nearly 94%.
Normally, I would focus on a single core industry or industry group when dealing with these sprawling sector indices, but because within the Fama-French classifications, there is no single grouping that makes up the bulk of the index, I am going to deal with each of the three largest Fama-French industries one by one and try to synthesize the findings at the end.
Because the Software industry is relatively young (data only begins in the 1960s) and there appears to be more similarity between Software and Entertainment (for which data goes back to 1926)–seemingly confirming the GICS industry group classifications to some degree–I am going to start with Entertainment, proceed to Telecommunications (data here also goes back to 1926), and then conclude with the Software industry.
Before doing that, however, let’s make a couple of simple observations about these groups and how they compare to the broader market, beginning with the dividend yield. At least on this basis, XLC continues to trade at a premium relative to the S&P 500, according to Seeking Alpha data.
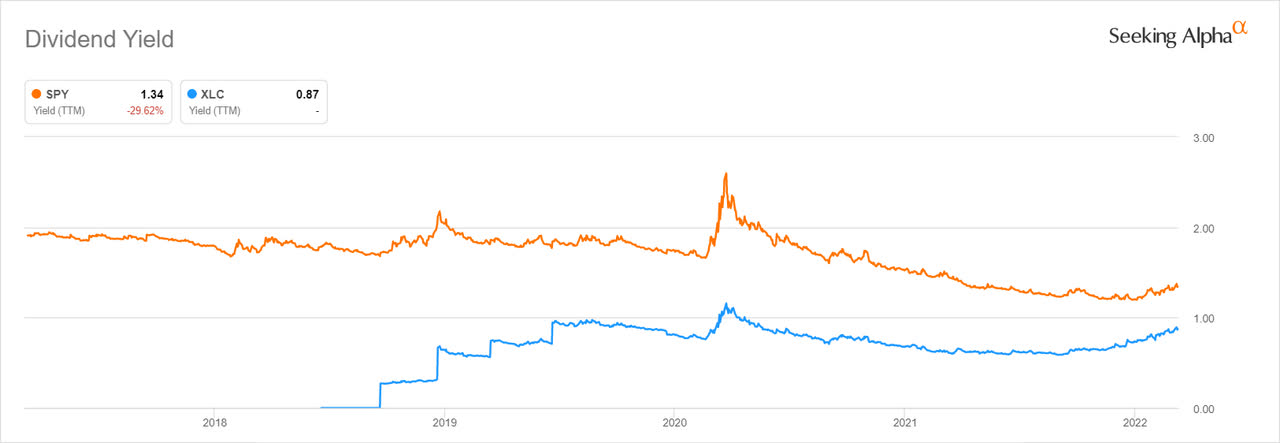
Chart C. XLC’s dividend yield remains well below the S&P 500’s (Seeking Alpha)
But, this has almost always been the case for the Software and Entertainment industries. In the following chart, I calculated historical dividend yields for these indexes by contrasting total returns with price returns.
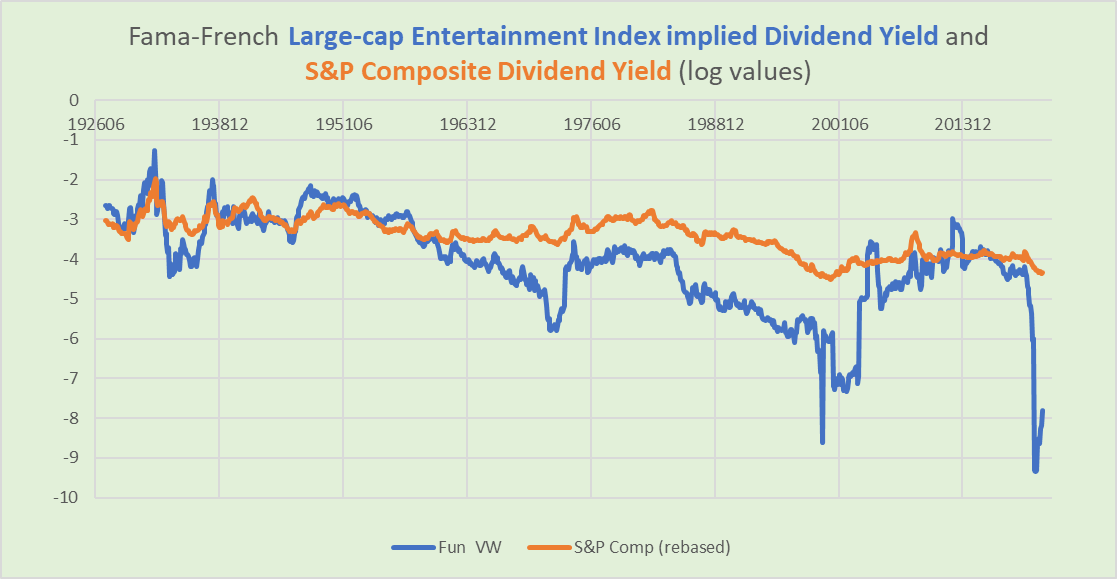
Chart D. Entertainment dividend yields only rarely exceed the S&P 500’s (Fama-French data, Shiller data)
Since the 1960s, at least, Entertainment yields have fallen to very low levels near tops in secular bull markets (1972, 1999, and 2021(?)).
Telecommunications yields have only rarely broken below the S&P’s.
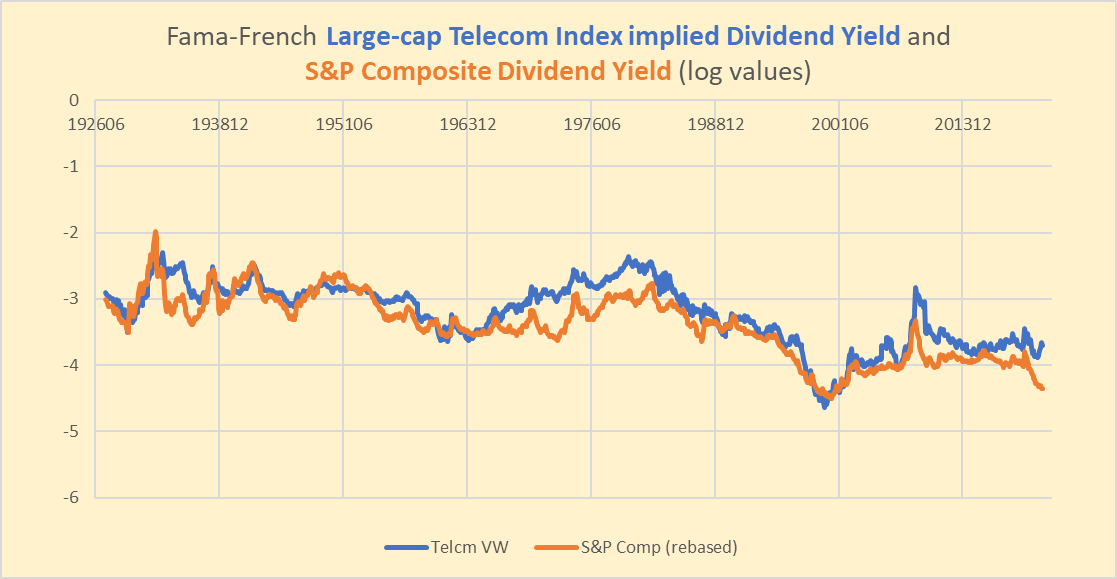
Chart E. The divided yield on Telecoms tends to slightly exceed the S&P 500’s (Fama-French data, Shiller data)
For Software and Entertainment, the yields have always been both low and volatile, the opposite of Telecoms.
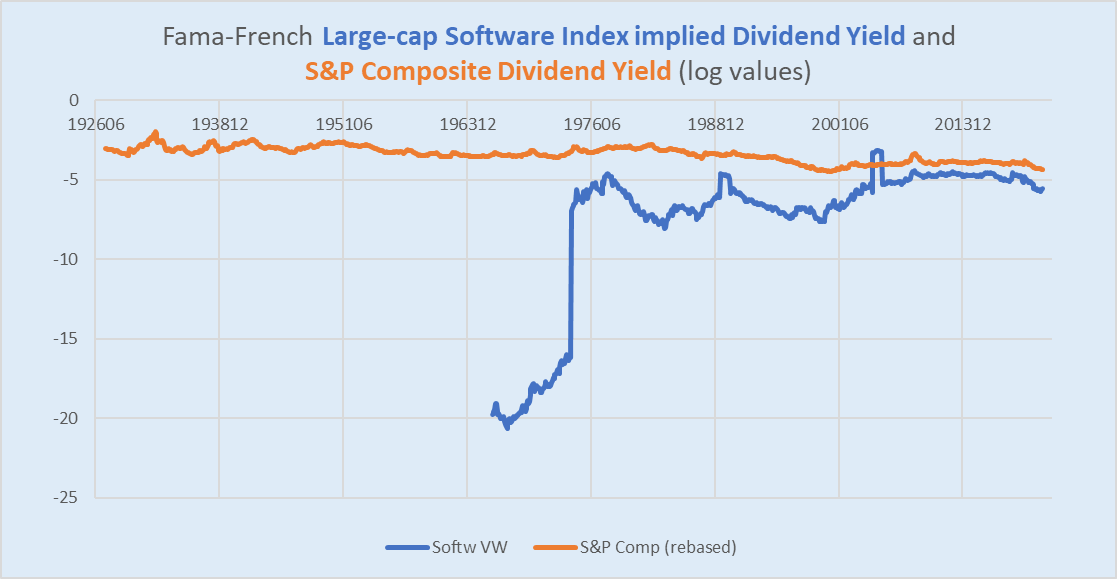
Chart F. Movements in the software stocks’ dividend yields dwarf those of the S&P 500 (Fama-French data, Shiller data)
But, my argument is less that they are “overvalued” relative to the S&P 500 than that they are likely overvalued within their respective historical contexts.
In order not to wear the patience of the readers too much, I am going to review their respective histories as efficiently as I can. First, fun.
Entertainment at risk of extremely low returns
Entertainment stocks have had four “secular” bear markets by my count: the Depression, the 1950s, the 1970s, and the early 2010s. Commodity data is a spliced index of Warren & Pearson wholesale data, the Fed’s PPIIDC index, and World Bank commodity prices.
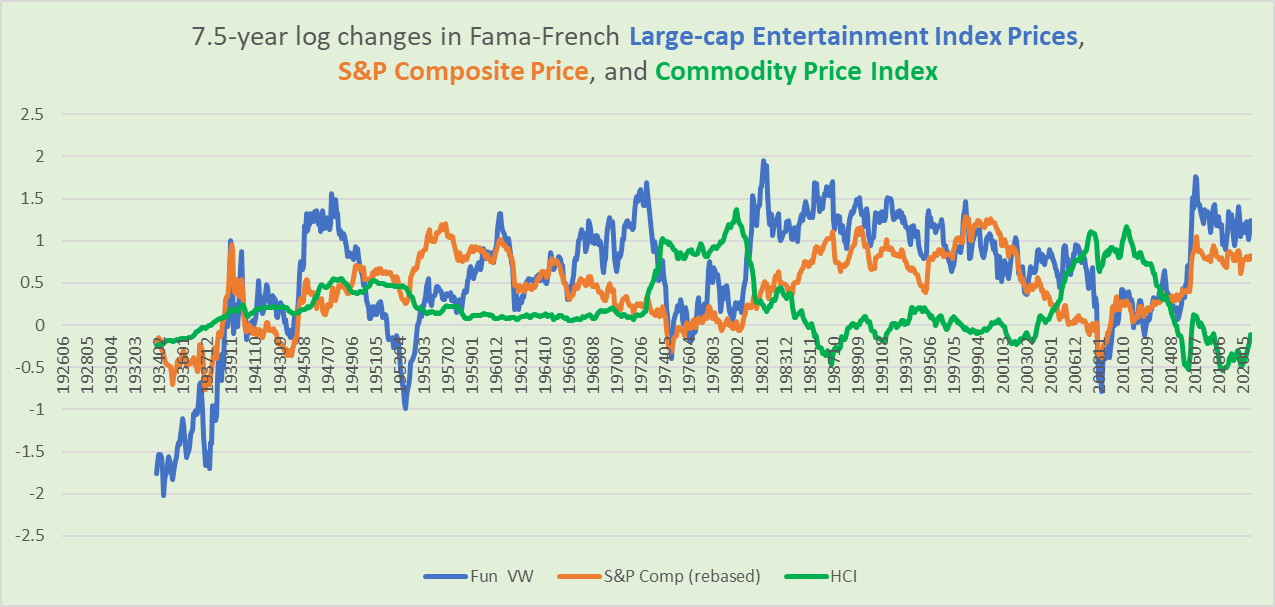
Chart G. Entertainment stocks do not like inflation, but they hate deflation (Fama-French, Shiller, World Bank, Warren & Pearson, & St Louis Fed)
The last three took place during relatively high levels of commodity inflation, but it is not clear from this vantage point what really drove the poor performance in the 1950s. The index had done quite well during the initial bout of high inflation of the 1940s. Clearly, the worst performance of the index was during the Depression. We can surmise that a simultaneous collapse in both growth and inflation is especially hard on the kind of discretionary spending that would normally go to entertainment.
If we look at relative total performances, we can see the damage done to Entertainment stocks by the Great Depression. Interestingly, their relative underperformance was already underway before the stock market peak of September 1929.
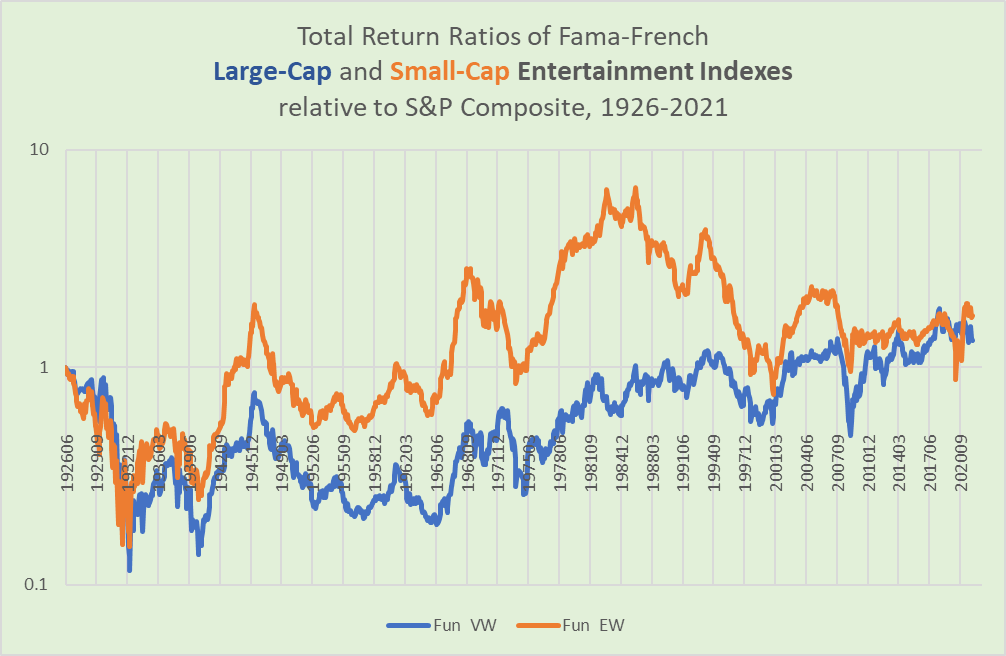
Chart H. It took about 50 years for entertainment stocks to regain their pre-Depression position (Fama-French, Shiller)
We mentioned above how, since the 1960s, drastic dips in the dividend yield typically occurred during market peaks. That condition coincided with the structural rise in Entertainment stock performance that began at the same time.
We are generally going to ignore small-caps in this article, but it is interesting to note the degree to which small-cap Entertainment stocks have underperformed large-caps since the early 1980s. Although I have yet to do a study comparing small-caps and large-caps by industry, this seems to be relatively rare. The only similar example I can think of at the moment is Software stocks, which we will look at later.
Large-cap Entertainment stocks have consistently outperformed bonds since the Depression, but it did take nearly 25 years for them to break even relative to the 1929 high.
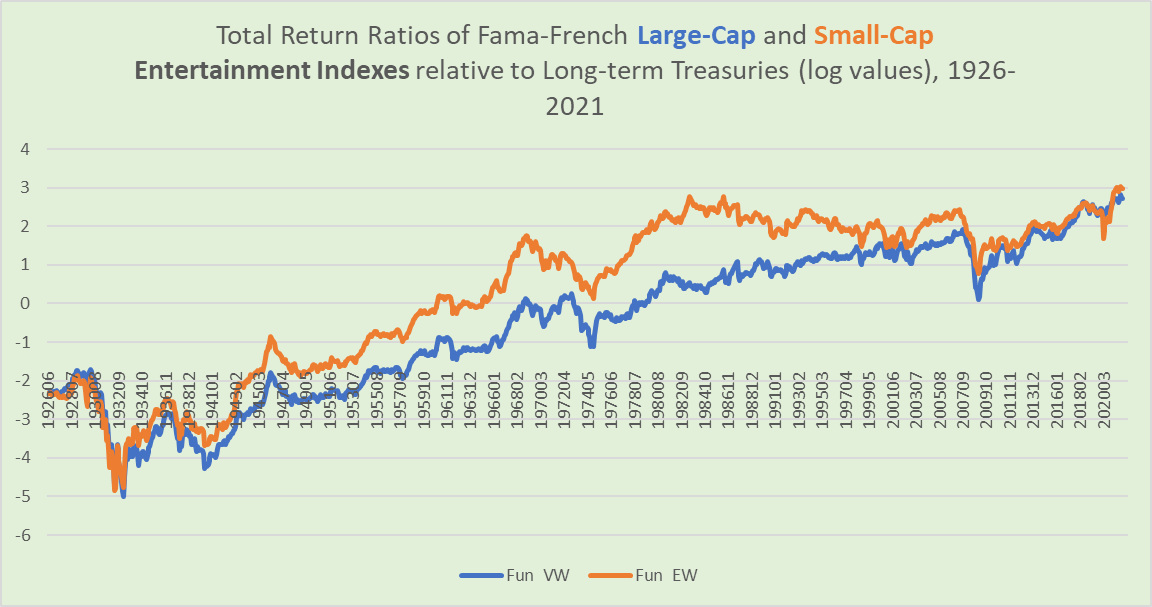
Chart I. Large-cap Entertainment stocks have only experienced two major shocks since the Depression (Fama-French, Shiller)
There were two other negative shocks, 1973 and 2008, which seem to have been generated by commodity inflation shocks.
Although I think energy shocks are the most likely culprit, the most ‘predictive’ commodity is fertilizers.
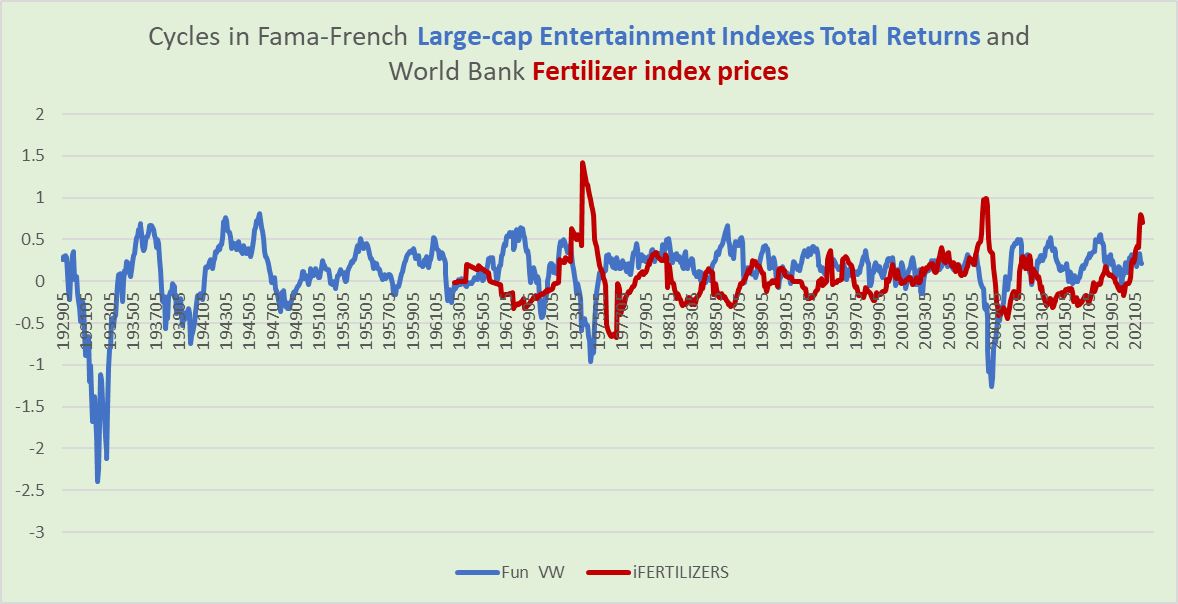
Chart J. Sometimes markets choose entertainment, sometimes they choose fertilizer (Fama-French, Shiller)
Fertilizer shocks tend to coincide with (and slightly lead) crashes in these stocks. The chart suggests that the current cycle is the third largest of the last sixty years. (The performance of fertilizer stocks like MOS, NTR, and CF suggests it may not be over yet).
If inflation shocks are bad, deflationary growth shocks are probably worse.
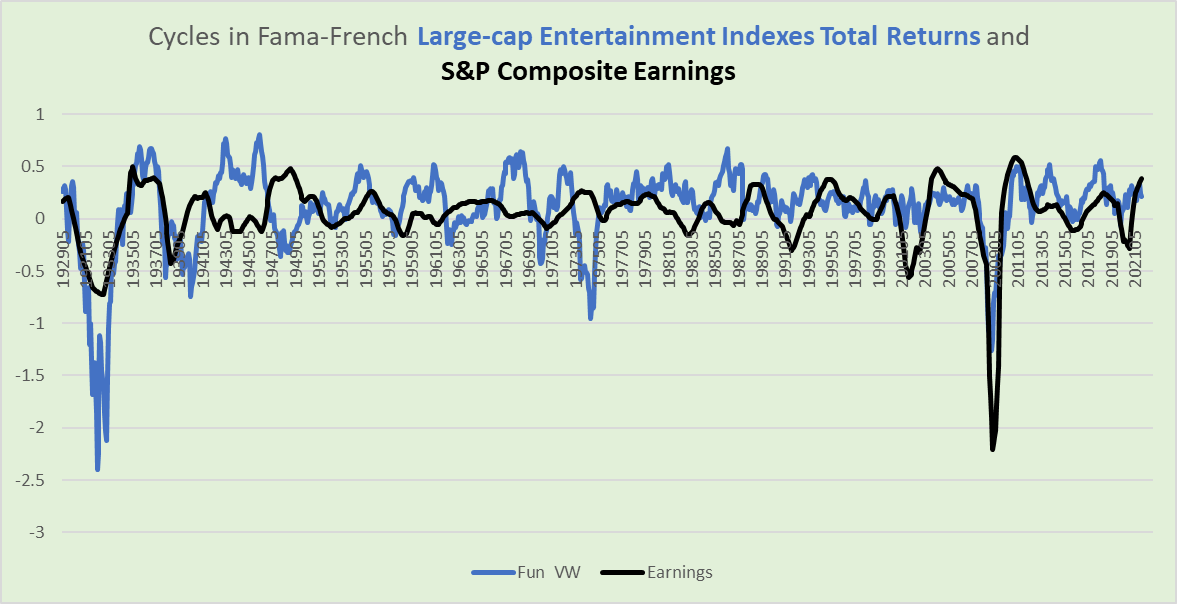
Chart K. Entertainment stocks are damaged most by dual growth-deflation shocks. (Fama-French, Shiller)
Volatile earnings cycles tend to coincide with volatile Entertainment returns.
Over longer-term intervals, the dividend yield has been a somewhat decent predictor of the industry’s returns. Low yields tend to be followed by low returns.
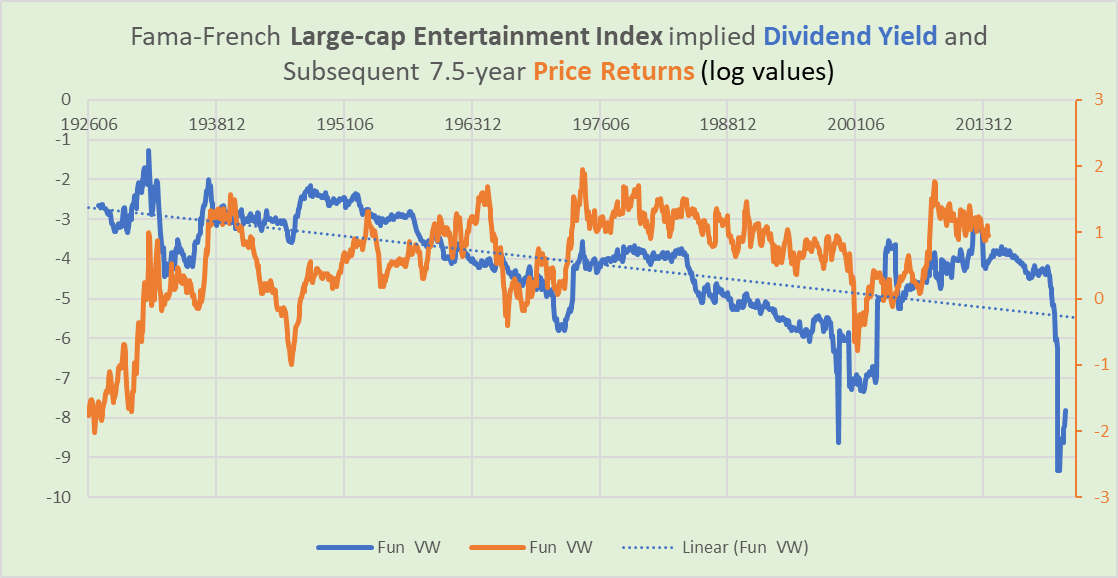
Chart L. Entertainment returns are somewhat correlated with the dividend yield (Fama-French data)
The dividend yield is actually a better predictor of dividend growth than it is returns. Low yields typically result in high dividend growth, as can be seen in the following chart.
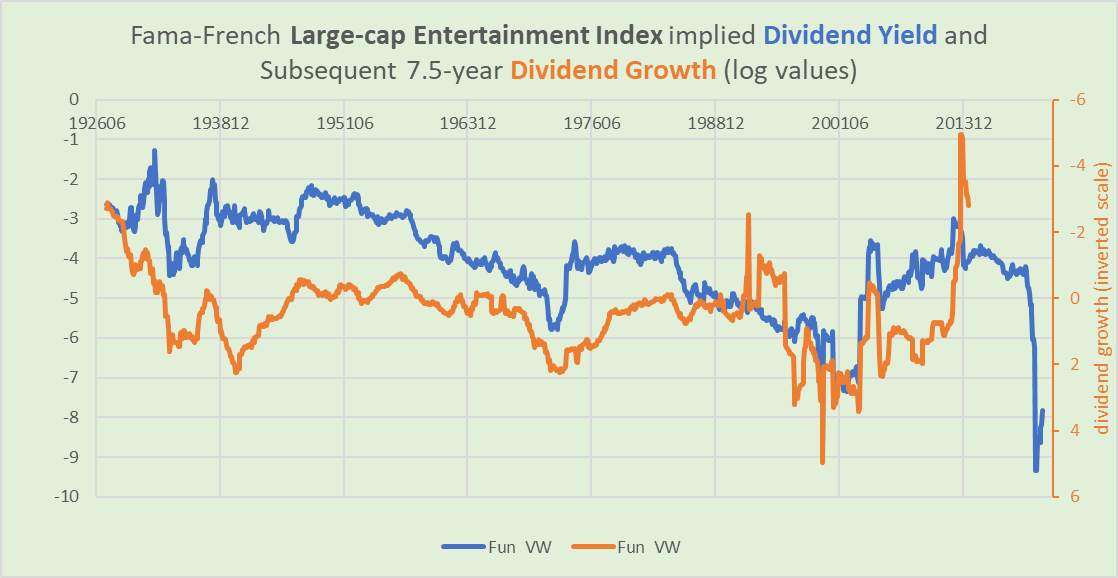
Chart M. Dividend growth is negatively correlated with the dividend yield. (Fama-French)
But, apart from the Depression and the recovery from the Depression, dividend growth and price returns tend to be negatively correlated (-0.1 since World War II).
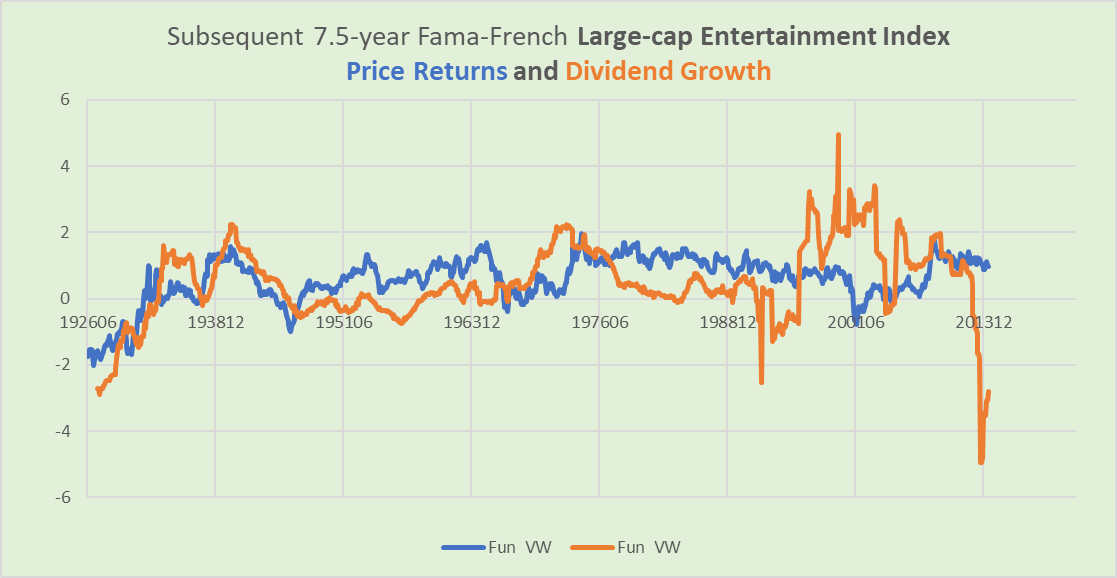
Chart N. Price returns and dividend growth tend to be negatively correlated (Fama-French)
Dividends go up during inflationary episodes, but prices do not. Under depressionary conditions, both go down, and in recovery, both rise. So history seems to suggest from the limited evidence we have.
With yields low, there is a risk of low long-term returns. On the positive side, dividends might grow, but optimism ought to be checked by the high level of cyclical inflation we have. That inflation raises the probability of a deflationary shock. If it is a temporary shock, we might see a sharp but “transitory” depression in Entertainment stocks. Were growth to be more persistently slowed, we might see persistently negative returns and negative dividend growth in the 2020s.
That covers the Entertainment industry. As mentioned earlier, many of the patterns we have found here are found in the Software industry, so it will be important to keep that in mind when we treat those stocks near the end. But, let’s contrast what we have found thus far with the Telecommunications industry first.
Telecommunications likely to do poorly but better than Entertainment
If Entertainment stocks languished in the Great Depression, Telecommunications stocks held up quite well and then did their best to keep up with the broader market after that.
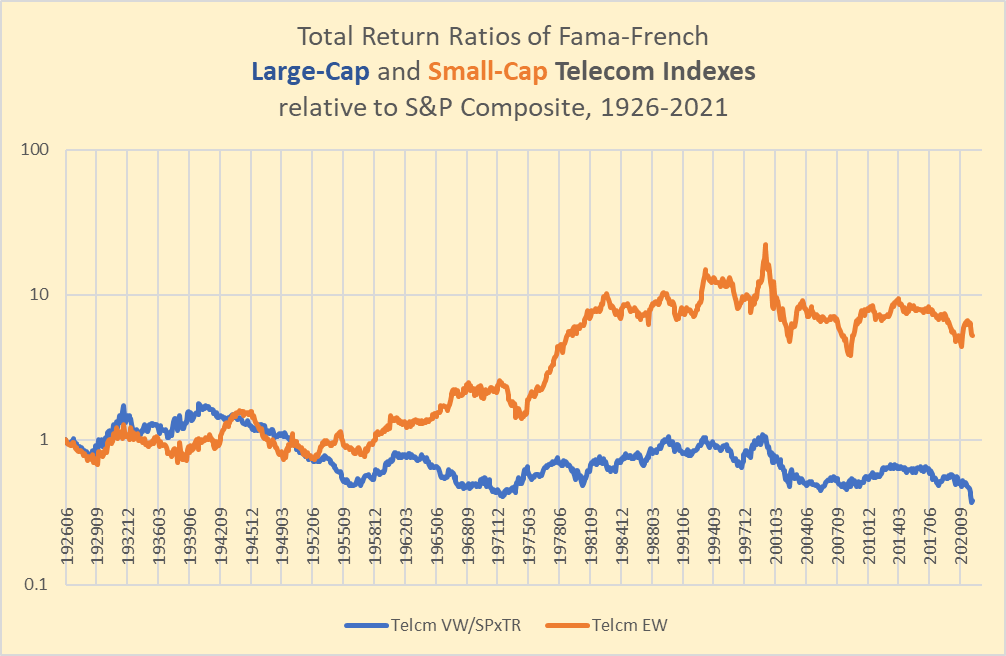
Chart O. Telecoms shined on a relative basis during the Great Depression. (Fama-French, Shiller)
Large-caps were nearly as good as bonds in the 1930s.
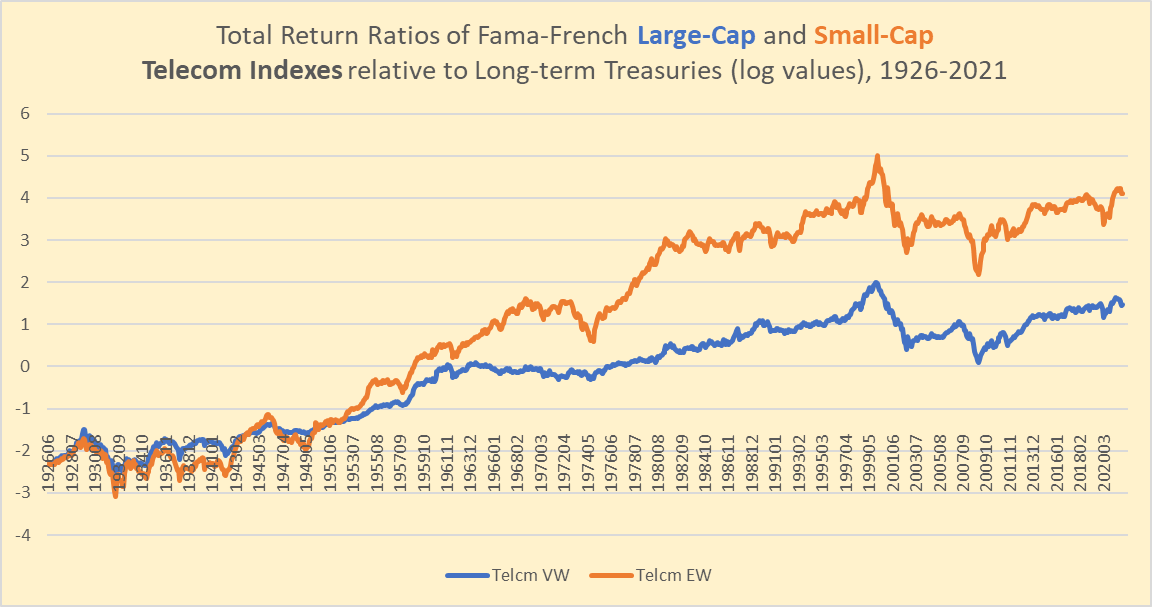
Chart P. Telecoms did nearly as well as bonds during the Depression, but have struggled to keep up since the Dot.com bust. (Fama-French, Shiller, St Louis Fed)
Both charts suggest they have struggled especially since the dot.com bust and never really recovered their old trajectory.
Telecoms prices generally track the wider market. I am not sure if “beta” is the right categorization, but since the 1960s, there has been something of a tendency for telecom prices to peak and trough at extremes relative to the S&P. If we think of the 1970s and 2000s as being general bear markets, telecoms stocks led the way down in both cases.
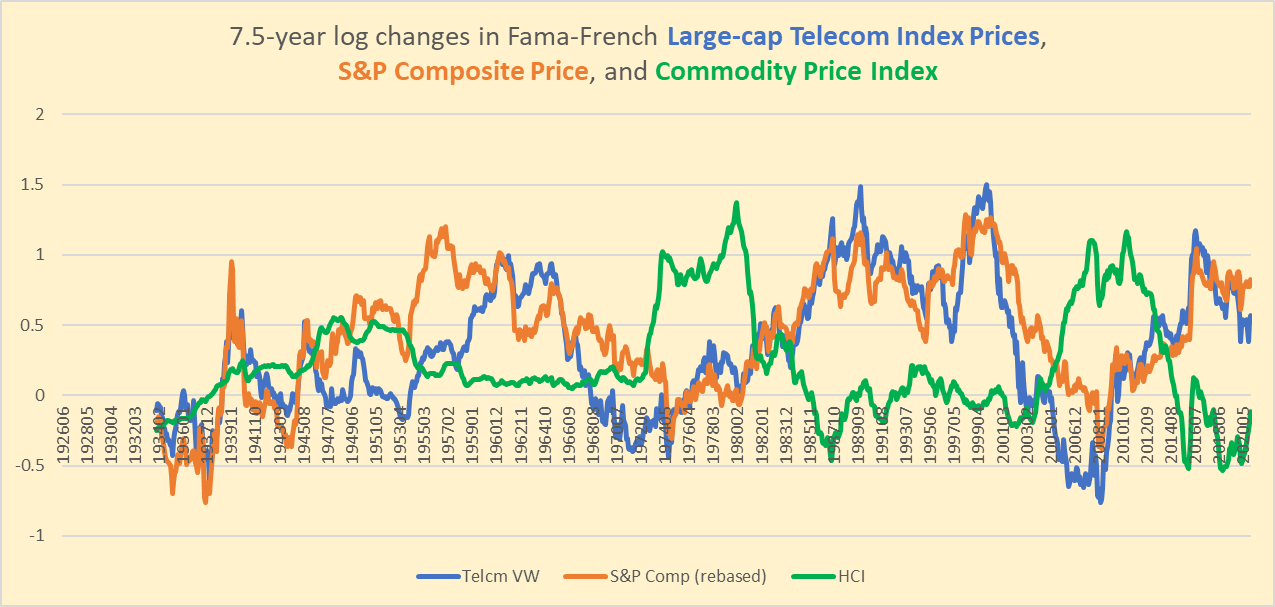
Chart Q. Telecoms almost seem to anticipate inflation. (Fama-French, Shiller, Warren & Pearson, St Louis Fed, World Bank)
Performance in the telecoms industry is typically low during periods of high commodity inflation, but it does not express the same sensitivity to cyclical inflation that we found in Entertainment or the broader market. The sharp cyclical falls since 2000 (see the following chart) seem to have been due primarily to telecom stocks having gotten caught up in the dot.com boom and the subsequent bust.
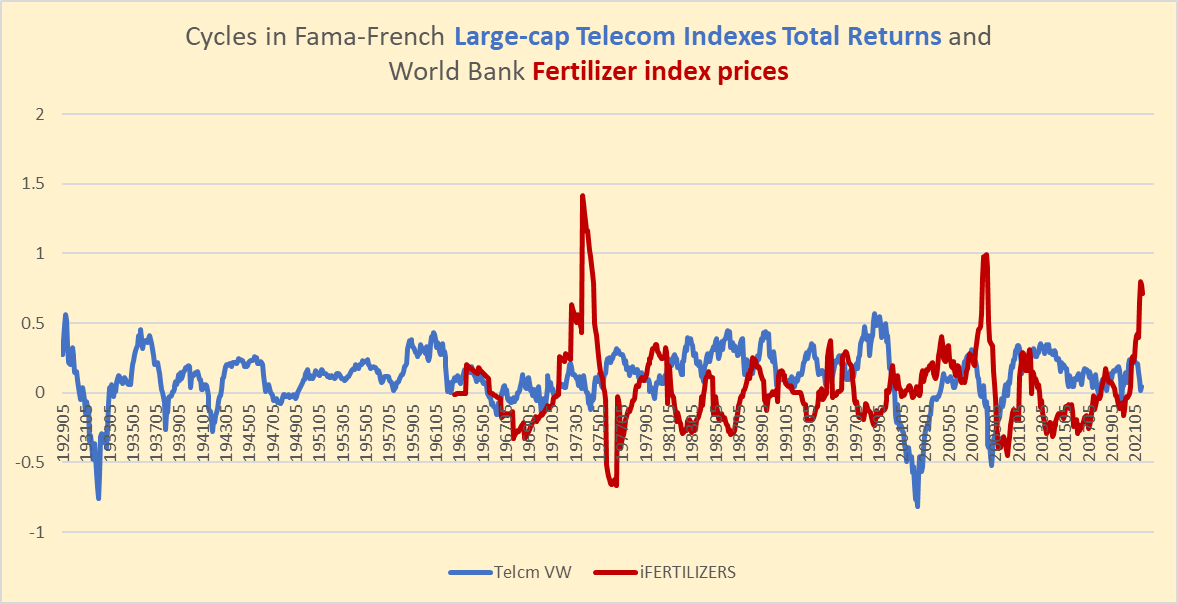
Chart R. Telecoms do not seem as vulnerable to cyclical inflation shocks. (Fama-French, World Bank)
Telecoms returns have consistently been anticipated by the dividend yield.
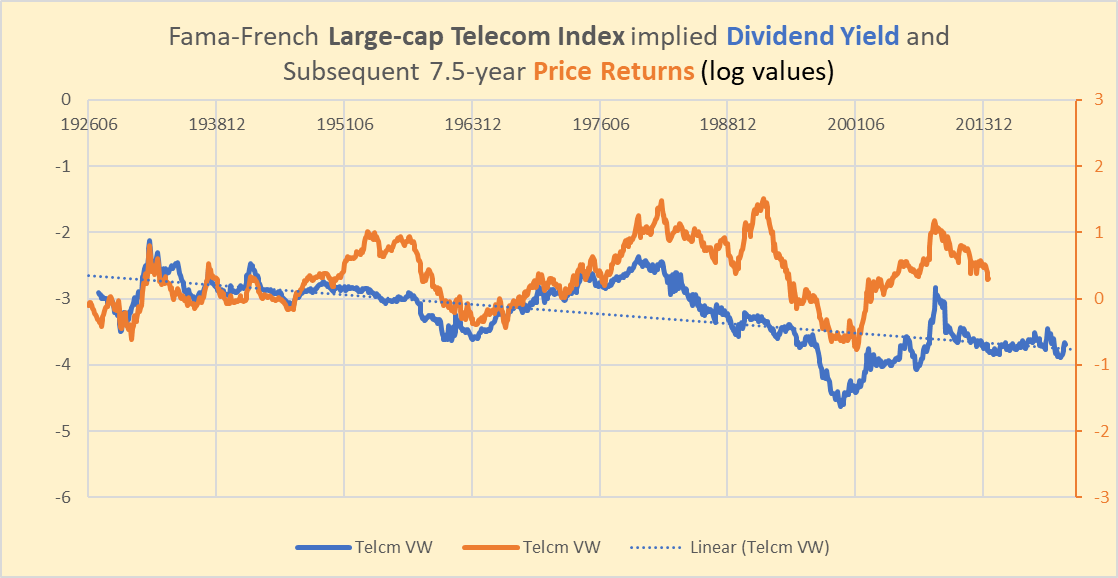
Chart S. The dividend yield has been a good predictor of telecoms returns. (Fama-French)
The correlation between the yield and subsequent total returns is 0.6.
With the dividend yield relatively low and relative performance already having peaked, one might expect returns in telecoms to be low but probably not as low as in Entertainment stocks. In case of a Depression-style outcome, the Telecommunications index might be expected to outperform Entertainment by a wide margin.
Software stocks likely to do very poorly in remainder of decade
Software stocks have one of the most unique profiles in the Fama-French indexes, primarily in the three-way relationship between valuations, dividend growth, and returns.
Recall from Chart H that dividend yields on Software stocks have always been significantly lower than those for the S&P. Price moves have also been much more extreme, as you can see in the following chart.
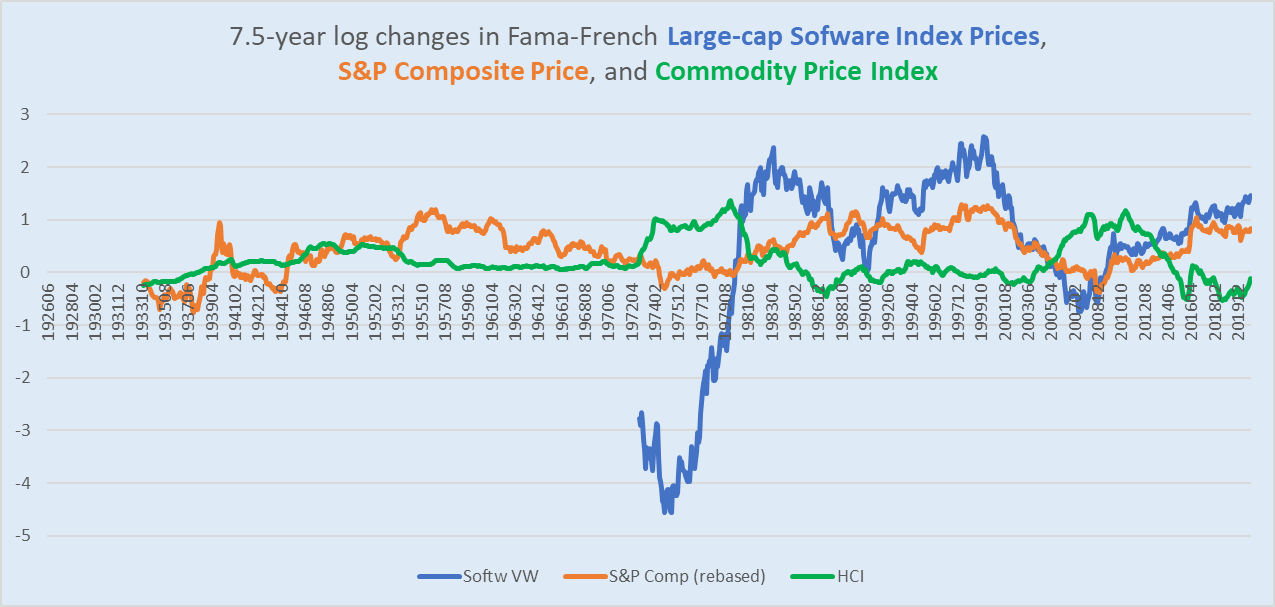
Chart T. Software stocks are extremely volatile over the long term. (Fama-French, Shiller, World Bank, St Louis Fed, Warren & Pearson)
As with most stock indexes, Software stocks do not like high and sustained commodity inflation.
The following chart shows that when S&P earnings growth (orange) exceeds commodity inflation (green), software stocks (blue) explode higher.
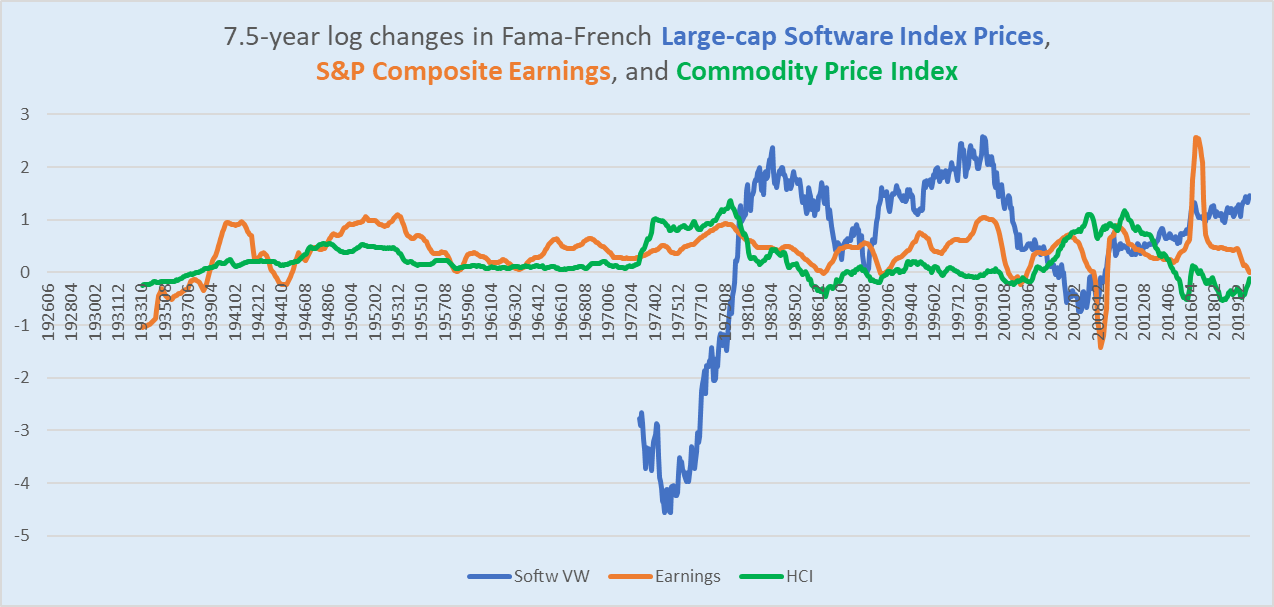
Chart U. Software stocks are extremely responsive to relative performance of S&P 500 earnings and commodities. (Fama-French, Shiller, World Bank, St Louis Fed, Warren & Pearson)
Somewhat surprisingly, in terms of relative performance, they have never caught up with where they were in the late 1960s.
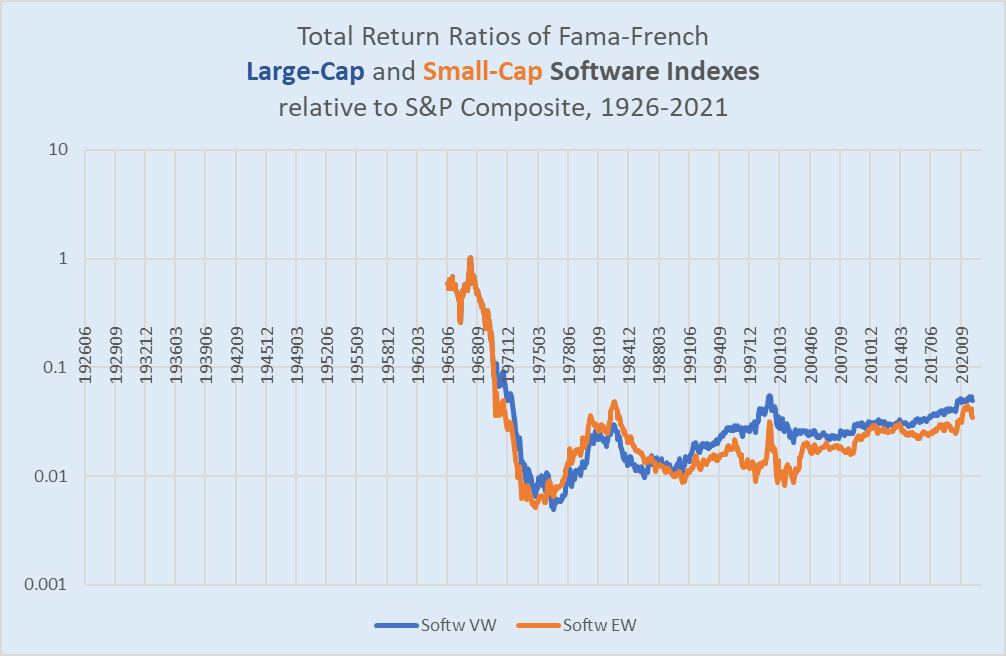
Chart V. Software stocks are nearly as high as they were in 2000 on a relative basis. (Fama-French, Shiller)
Even relative to Treasuries!
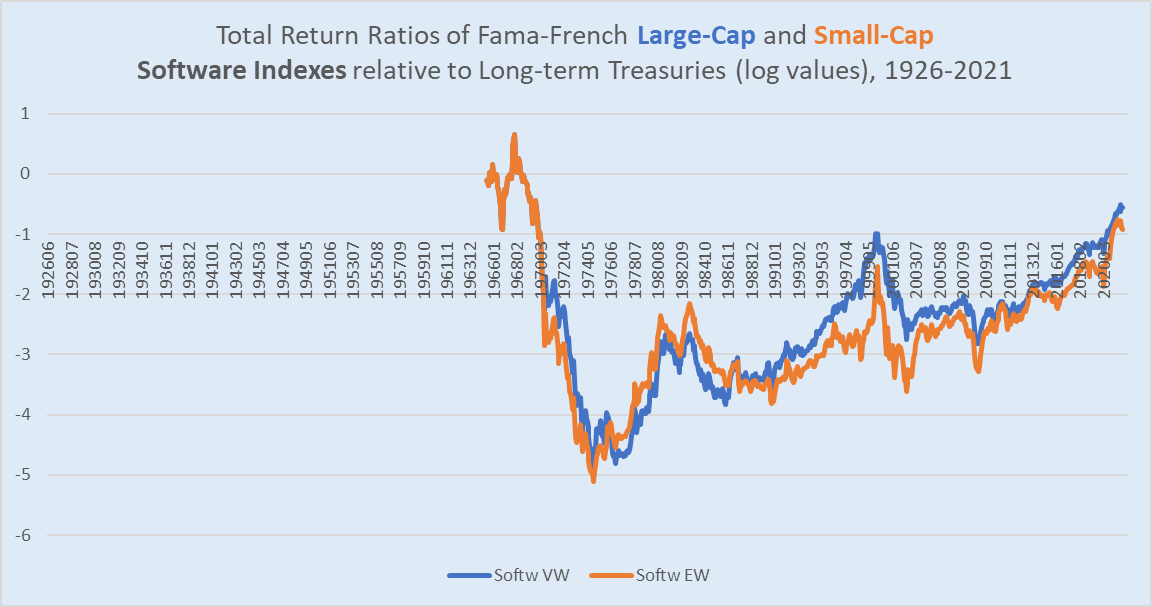
Chart W. Software stocks experience great swings in returns. (Fama-French, Shiller, St Louis Fed)
A couple of asides about this chart: First, notice that as with the Entertainment industry, small caps have largely underperformed large caps since the 1980s. Second, I suspect there may be some sort of distortion caused by a small sample size since the equal-weighted and value-weighted indexes performed identically up until the 1970s (I suspect the number of stocks was 1).
In any case, there has been a strong correlation between the dividend yield and returns.
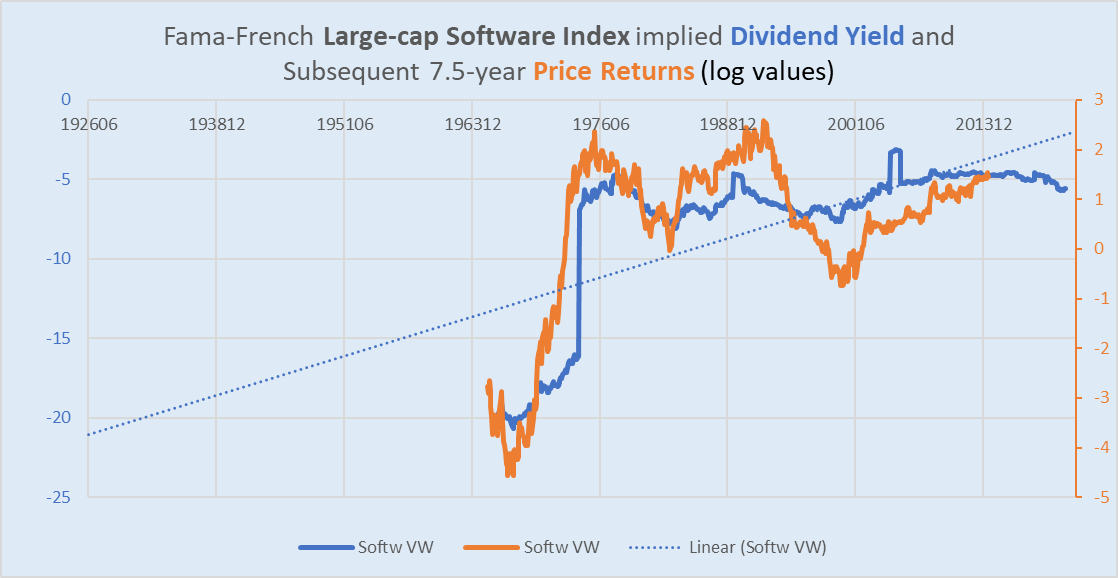
Chart X. Dividend yields have been good predictors of software returns. (Fama-French)
And, there has been a strong negative correlation between the dividend yield and subsequent dividend growth.
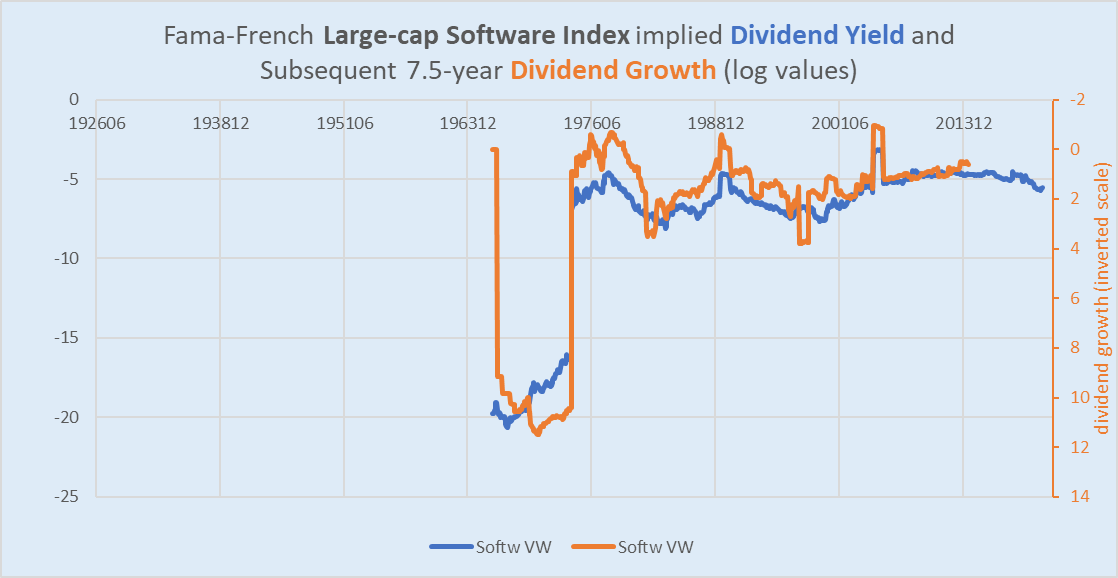
Chart Y. Dividend yields have also been good predictors of dividend growth in software stocks. (Fama-French)
This then leads to a strong negative correlation between dividend growth and price performance.
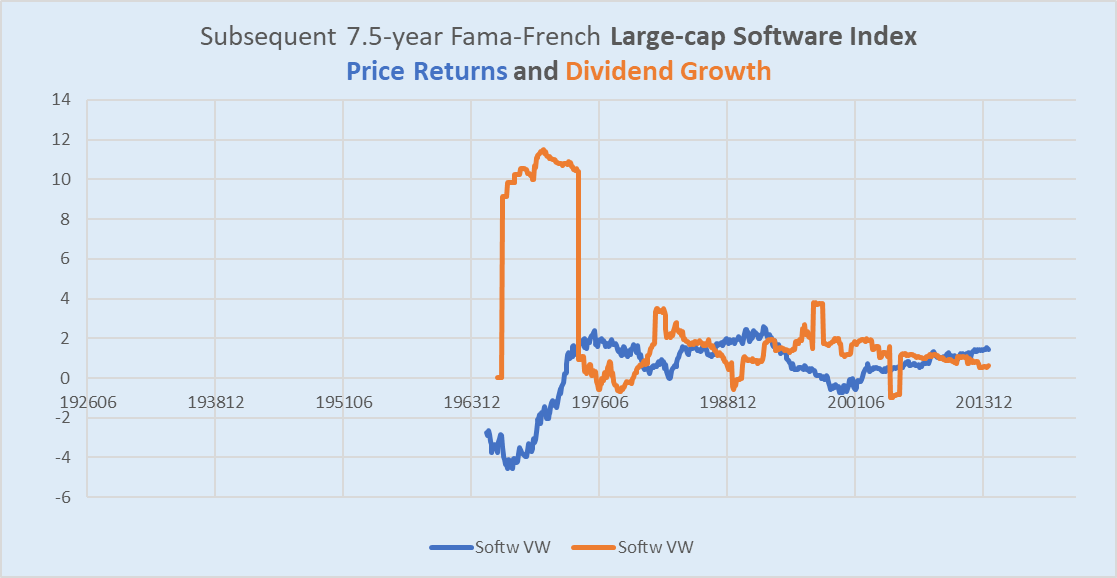
Chart Z. Dividend growth and price returns are negatively correlated in software stocks. (Fama-French)
The dividend growth does not appreciably alter the correlation between the dividend yield and returns. The dividend yield has a -0.82 correlation with both price and total returns.
It is hard to say if these types of correlations will hold indefinitely. The evidence seems to point to an industry that is slowly converging with the broader market, particularly in terms of the levels of the yields and the respective rates of return. Yet, convergence itself suggests that the negative correlation between the dividend yield and returns will hold since this appears to be a property of modern markets, as evidenced by the relationship between the CAPE ratio and subsequent returns.
In short, although the dividend yield on Software stocks is near its historical average, it is the highest it has been in nearly 20 years. Maturation of the sector results in higher dividend growth and lower returns suggesting perhaps multiples that are likely to be lower and lower at each “secular” peak.
I think this interpretation is backed by an analysis of tech stocks in general.
The Tech Sector
If we were to categorize XLC’s holdings by Fama-French’s 12-sector data, we would find that 54% of the stocks are categorized as Business Equipment and 32% as Telecoms. Based on an analysis of historical sector performances, I have found that Business Equipment stocks are likely to both underperform the broader market over the remainder of the 2020s while cyclical sectors like Energy are likely to outperform. This is likely to coincide with low returns for the market as a whole until the end of the decade. On top of that, an analysis of the patterns in S&P Composite price and earnings suggests very low returns for markets both during the remainder of the 2020s and 2030s.
Tech booms, especially when they coincide with depressed energy performances (in both equities and the raw commodities), tend to be followed by substantially lower market returns, especially in the tech sector, despite subsequent real technological growth (this is something I covered in my piece on electric vehicles).
The thing that pops these bubbles or at least signals that a bubble is about to pop is a sudden, cyclical surge in commodities, especially energy prices, just as we have experienced since the oil prices recovered from their pandemic lows.
Conclusion
Tech stocks are likely to underperform in the 2020s—I suppose we can say “continue underperforming”, at this point—and the patterns we find there are not only reflected but amplified in the relatively young Software industry.
Entertainment stocks are among those which I refer to as “Baumol stocks”, stocks that appear to benefit from the process of “cost disease”. In the real economy, William Baumol found that technological progress drives up relative prices in the services sector (healthcare, education, entertainment, government, etc) while driving down relative prices in the durable goods sector (computers, cars, phones, etc). But within the realm of equities, these sectors have outperformed cyclical (typically, industrial and commodity) sectors over the long term. This may be why tech stocks (such as Software industry stocks) and Entertainment stocks seem to have similar profiles. The extreme lows in the Entertainment industry’s dividend yield suggest both a peak in the market as a whole and substantially lower returns in the 2020s.
That leaves the Telecommunications component. As with the S&P 500, the low dividend yield suggests low returns, especially in the early stages of a secular slowdown, but it is likely to outperform both Entertainment and Software stocks in the remainder of the decade. History suggests that, if a Depression-like outcome were to occur–and I believe the chances of such an outcome are high–telecoms could significantly outperform those two other industries, even though returns are still likely to be negative.
To put this back in the language of the GCIS classifications, XLC is likely to underperform the S&P 500 over the remainder of the decade, and within XLC, stocks in the Telecommunications Services Industry Group are likely to outperform those in the Media & Entertainment Industry Group.
[ad_2]
Source links Google News

