[ad_1]
Aliaksandr Yarmashchuk/iStock via Getty Images
In my last article, Weakness In Industrials Is A Warning, I argued that there are two important themes at play in equity markets at present, but in this article, I am going to divide them up into three in the hopes of making my thesis clearer. First, there is the long-term rotation out of tech stocks and into cyclicals, most notably energy. Second, there is the onset of a “secular” bear market in equities generally. Third, there is a cyclical downturn.
These three themes are interrelated. When tech stocks outperform the market as a whole over “secular” spans, the stock market as a whole tends to soar, except for cyclicals which often languish (especially energy) or just barely hold their own (often, industrials). This kind of tech outperformance typically occurs during the final years of “secular” bull markets in equities (most famously in the 1920s and 1990s). What follows is sharply negative returns for tech stocks, flat to negative returns for the market as a whole, and outperformance by cyclicals (most notably energy), typically for something like a decade.
What is more, the tech-dominant “secular” bull market often concludes with a powerful rally in cyclicals, most obviously in the form of an energy shock. In other words, cyclicals and “the cycle” start to reimpose themselves before tech’s run is over. That is what happened in the wake of the 1998 crisis and in the run up to the dot.com bubble popping, and that is what has been happening in the wake of the pandemic market crisis of 2020, I believe.
The trick, then, is to recognize that these themes overlap and intertwine with one another but not to confuse them. There is, unfortunately, a fourth theme, and that is whether or not the “secular” bear market is likely to be inflationary or deflationary in nature. If it is inflationary, cyclicals could see significant absolute gains despite general market weakness. This is what happened in the 2000s. If it is deflationary, all sectors are likely to see negative returns for the remainder of the decade, no matter which sector outperforms. This is what happened in the 1930s. I lean towards a 1930s’ style scenario for the 2020s: negative returns across the market, low inflation, low growth, and highly cyclical market behavior.
Whether or not this bear market that I presume is coming is inflationary or deflationary, the most important thing from an investing point of view is that it will be cyclical. Markets will experience dramatic falls followed by dramatic surges, as was the case in the 1930s, 1970s, and 2000s. And, highly cyclical sectors are an important clue as to the status of that trade.
Contrasting recent performances in XLI and XLB
Of the market sectors, Industrials (XLI) and Basic Materials (XLB) are perhaps the two most cyclical. (Energy (XLE) is also a contender but tends to be strongest late in the cycle). And this month, both of those sectors have begun flashing the ‘sell’ signal on the little algorithm I like to use. In my industrials article mentioned at the beginning, I found that that this was being driven primarily from within the core of the industrials index but with a little additional help from more tech-related subindustries in XLI.
But, my thesis with XLB will be somewhat different. Although, as with XLI, the core of XLB (that is, the chemicals industry group) is also turning down and is highly cyclical, the XLB is exhibiting somewhat more strength than its industrial twin, and this strength is coming out of the most cyclical subindexes of the materials sector.
In other words, in XLI, Capital Goods is both the core of the index and its most cyclical industry group, and that industry group’s own core industries are also the most cyclical of the group. And, weakness in these core cyclicals is what has been driving XLI down. But, in XLB, the core of the index (again, chemicals) is highly cyclical but is less cyclical than some subindustries that have remained strong over the last month. XLB is being driven down by this cyclical industry group, but the somewhat more peripheral commodity-related subindices is keeping the materials sector aloft.
Thus, in XLB, the cyclical picture is currently more fractured than it is in XLI.
How to trade XLB in the coming bear market
What is more, even though I am bearish both short-term (say two years) and long-term (till the end of the decade) on XLB, history suggests that it has greater long-term potential to outperform the wider market than most sectors, including industrials. In many ways, therefore, my argument on basic materials stocks stands somewhere between my position on XLE and XLI. That is, energy stocks (and to a lesser extent, industrials) are likely to outperform the market over the long-term but will also be vulnerable both to the long-term bearishness that will pervade markets generally and to the whims of the market cycle.
Based on all of these principles, I would argue for three investment strategies for dealing with long-term bear markets, ranked from best to worst:
First, trade the cycle. Constantly pore over data late into the night.
Second, if you cannot trade the cycle, divide your investments equally across asset classes (stocks, long-term Treasuries, commodities (especially precious metals), and perhaps property) while concentrating stock allocations in cyclicals (and avoid tech). Lower your alpha and beta, and get a decade or two of restful sleep in exchange.
Third, call the top of the bull market and predict whether the subsequent bear market will be biased towards inflation or deflation. If it is biased towards deflation, sell everything except bonds. If it is biased towards inflation, put everything in commodities and commodity-friendly instruments. Be a prophet; if proven wrong, blame the Fed and consider starting a militia.
I have staked my positions on strategies two and three in previous articles, so in this article, as with my articles on XLE and XLI, I am focusing more on the first strategy, but I will attempt to place this cyclical outlook within a long-term context.
As with my analysis of XLI, I am going to break up XLB into its constituent industries and analyze them based on Fama-French sector and industry data that goes back to 1926.
What’s in the XLB?
As the chart below from State Street Global Advisors shows, XLB is dominated by the Chemicals industry.
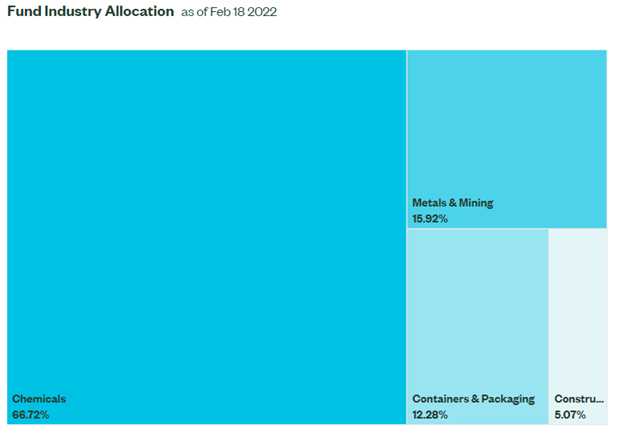
Chart A. The Chemicals Industry rules the XLB. (State Street Global Advisors)
Metals & Mining form a distant second, Containers & Packaging a close third, and finally Construction Materials fourth.
Further subdivisions can be seen in the following chart, from S&P Global.
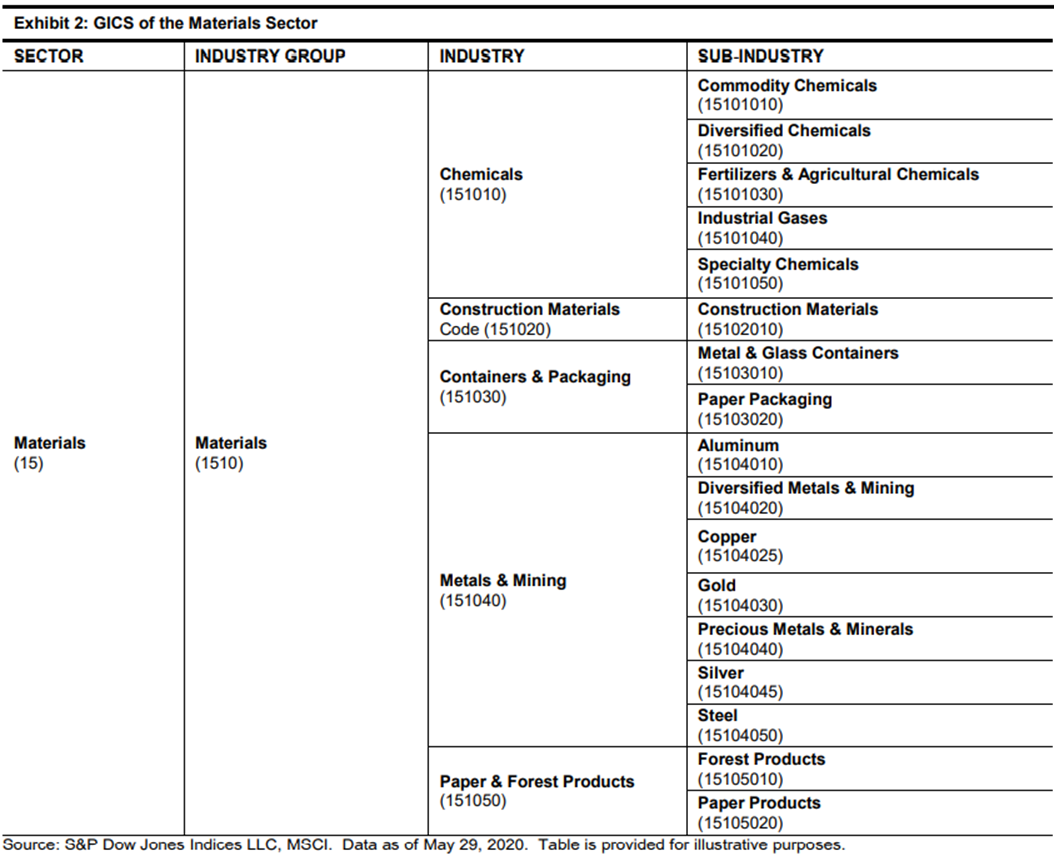
Chart B. XLB is relatively concentrated at the industry group level. (S&P Global)
One difference between XLI and XLB is that the former is divided into a handful of industry groups whereas the latter has only one industry group, itself. Industry groups then are subdivided into industries, and those are each further divided into subindustries. (There appear to be no Paper & Forest Products stocks in the XLB at present).
The size of the industry appears to have little bearing on how many subindustries it contains. Indeed, it appears that the XLB no longer even includes Diversified Chemicals stocks. That is likely because XLB only includes companies that both have the requisite GICS industry code and are large enough to be included within the S&P 500. The underlying construction of these indices can change depending on how experts perceive sectoral/industrial behavior clusters around certain characteristics, on companies being assigned new codes, and on companies within a certain category falling out of the S&P 500.
S&P Global lists the subindustry weights of XLB as follows.
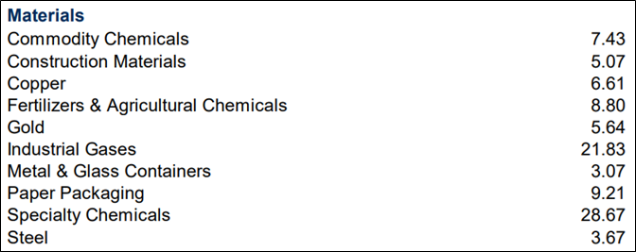
Chart C. Industrial Gases and Specialty Chemicals comprise half of the XLB. (S&P Global (modified by author))
Industrial Gases and Specialty Chemicals make up half of the index.
The Chemicals industry is by far the most cyclical of the four Materials industries, but certain subindustries within the Metals & Mining category, most notably Aluminum, Copper, and Steel, are even more cyclical than Chemicals.
The chart below shows the performance of the four Materials industries ranked by their weighting within XLB over the last year.
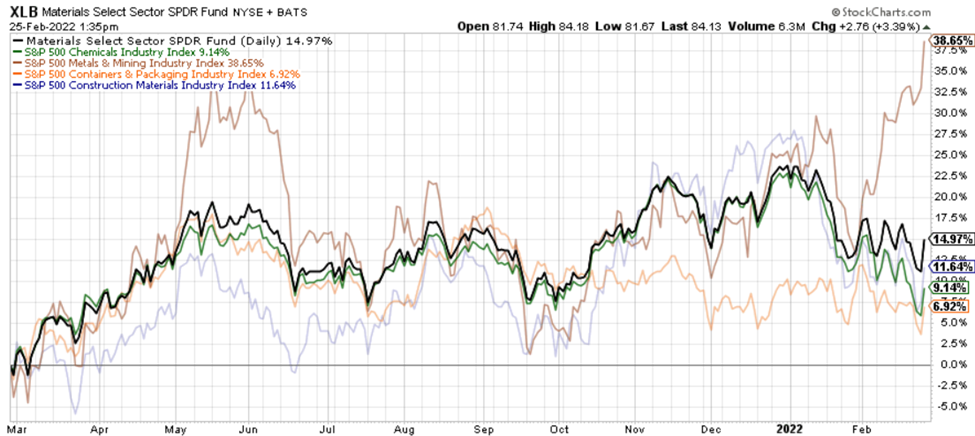
Chart D. Metals & Mining stocks have parted company from the rest of the XLB. (Stockcharts.com)
Chemicals and Construction Materials have been falling since New Year’s, and Containers & Packaging joined in at the beginning of February, and each of these are within striking range of their 52-week lows. Metals & Mining, however, broke away from the pack at the beginning of the month. Again, we will come back to Metals & Mining, but Chemicals are clearly the core of the XLB.
The XLB only goes back to 1998, so in order to put the ETF in historical perspective, we have to use comparable data from the Fama-French data set, and that requires us to classify companies by SIC code rather than the relatively new GCIS classifications.
Classifying XLB stocks by Fama-French criteria
In the table below, I have listed the constituents of XLB along with both their GCIS and Fama-French 49-industry and 12-industry SIC classifications. The 12-industry classifications are effectively equivalent to sectors.
|
XLB holdings as of 18-Feb-2022 |
|||||||
|
Name |
Ticker |
Weight |
Cumulative Weight |
GCIS Sector |
FF49 |
FF12 |
|
|
Linde plc |
LIN |
16.2 |
16.2 |
1 |
Chemicals |
Chemicals |
Chemicals |
|
Sherwin-Williams Company |
SHW |
6.8 |
23.0 |
2 |
Chemicals |
Retail |
Shops |
|
Freeport-McMoRan Inc. |
FCX |
6.6 |
29.6 |
3 |
Metals & Mining |
Mines |
Other |
|
Newmont Corporation |
NEM |
5.6 |
35.2 |
4 |
Metals & Mining |
Precious metals |
Other |
|
Air Products and Chemicals Inc. |
APD |
5.6 |
40.8 |
5 |
Chemicals |
Chemicals |
Chemicals |
|
Dow Inc. |
DOW |
4.7 |
45.5 |
6 |
Chemicals |
Chemicals |
Chemicals |
|
Ecolab Inc. |
ECL |
4.7 |
50.1 |
7 |
Chemicals |
Consumer goods |
Chemicals |
|
DuPont de Nemours Inc. |
DD |
4.3 |
54.4 |
8 |
Chemicals |
Chemicals |
Chemicals |
|
Corteva Inc |
CTVA |
3.9 |
58.2 |
9 |
Chemicals |
Agriculture |
Consumer nondurables |
|
PPG Industries Inc. |
PPG |
3.7 |
62.0 |
10 |
Chemicals |
Chemicals |
Chemicals |
|
Nucor Corporation |
NUE |
3.7 |
65.6 |
11 |
Metals & Mining |
Steel |
Manufacturing |
|
International Flavors & Fragrances Inc. |
IFF |
3.6 |
69.2 |
12 |
Chemicals |
Chemicals |
Chemicals |
|
Ball Corporation |
BLL |
3.1 |
72.3 |
13 |
Containers & Packaging |
Shipping containers |
Manufacturing |
|
LyondellBasell Industries NV |
LYB |
2.7 |
75.0 |
14 |
Chemicals |
Chemicals |
Chemicals |
|
Vulcan Materials Company |
VMC |
2.6 |
77.6 |
15 |
Construction Materials |
Mines |
Other |
|
Martin Marietta Materials Inc. |
MLM |
2.5 |
80.1 |
16 |
Construction Materials |
Mines |
Other |
|
Albemarle Corporation |
ALB |
2.3 |
82.4 |
17 |
Chemicals |
Chemicals |
Chemicals |
|
Amcor PLC |
AMCR |
1.9 |
84.3 |
18 |
Containers & Packaging |
N/A |
Consumer durables |
|
International Paper Company |
IP |
1.9 |
86.2 |
19 |
Containers & Packaging |
Business supplies |
Manufacturing |
|
Mosaic Company |
MOS |
1.7 |
87.9 |
20 |
Chemicals |
Chemicals |
Chemicals |
|
Eastman Chemical Company |
EMN |
1.7 |
89.6 |
21 |
Chemicals |
Chemicals |
Chemicals |
|
CF Industries Holdings Inc. |
CF |
1.6 |
91.3 |
22 |
Chemicals |
Chemicals |
Chemicals |
|
Celanese Corporation |
CE |
1.6 |
92.9 |
23 |
Chemicals |
Chemicals |
Chemicals |
|
Avery Dennison Corporation |
AVY |
1.6 |
94.5 |
24 |
Containers & Packaging |
Business supplies |
Manufacturing |
|
FMC Corporation |
FMC |
1.5 |
96.0 |
25 |
Chemicals |
Chemicals |
Chemicals |
|
Packaging Corporation of America |
PKG |
1.5 |
97.5 |
26 |
Containers & Packaging |
Shipping containers |
Manufacturing |
|
WestRock Company |
WRK |
1.3 |
98.8 |
27 |
Containers & Packaging |
Shipping containers |
Manufacturing |
|
Sealed Air Corporation |
SEE |
1.1 |
99.9 |
28 |
Containers & Packaging |
Chemicals |
Chemicals |
By Fama-French classifications, XLB is composed of 57% chemicals stocks, 13% manufacturing, 12% mines, 7% retail, 6% precious metals, 4% agriculture, and 2% consumer durables. The biggest discrepancies between GCIS and Fama-French at the company level are with Sherwin-Williams, which the former classifies as a chemicals company and the latter classifies as consumer-oriented. At the industry level, the biggest discrepancy is that most of the GCIS Containers & Packaging companies are classified as Manufacturing companies within the Fama-French criteria.
By any measure, the chemicals industry forms the core of the XLB, and so that will form the core of this analysis of the index.
The chemicals industry in historical perspective
Last year, in A Primer On Long-Term Sector Rotations And Where We Are Now, we saw that by looking at the magnitude of sectoral dispersions and the ranking of long-term sectoral performances, among other things, we can anticipate which sectors will outperform and underperform over the subsequent seven years. The most important sectors have been Business Equipment (tech), Energy, and Health. Based on that analysis, which I updated recently in Big Tech Has A Lot Farther To Fall, it appears that tech will severely underperform the broader market while energy will outperform in the 2020s. Overall market returns are likely to be depressed.
The Chemicals sector, however, plays a role that largely mirrors Energy over the long term. The following chart shows the relationship between the relative performances of Chemicals, Health, and Business Equipment compared to the performance of the market index as a whole.
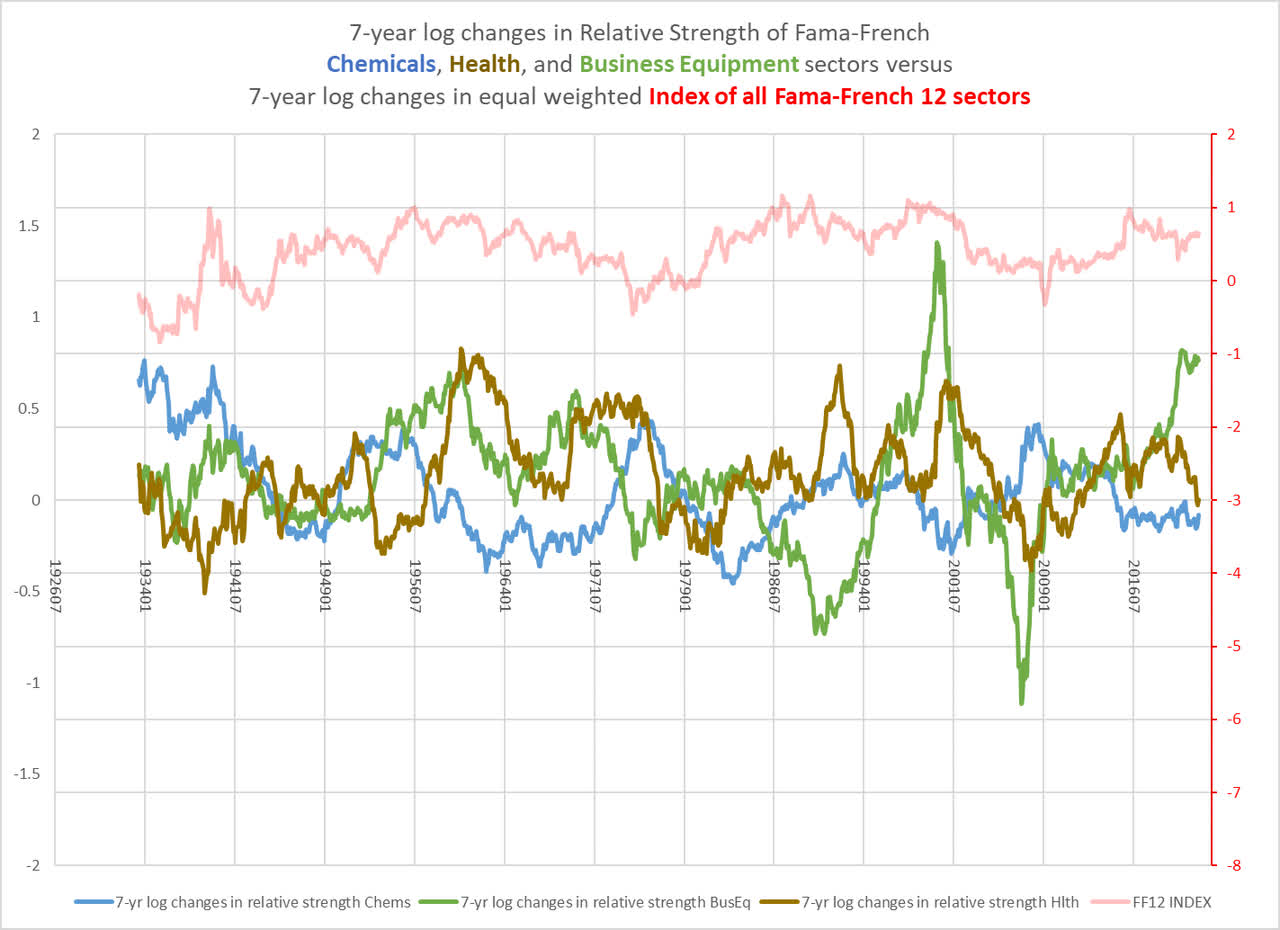
Chart E. Weak Chemicals stocks has been good for the market historically. (Own calculations from Fama-French data)
Where the long-term performance of Business Equipment stocks has triumphed and Chemicals has languished, market returns as a whole tend to be high. As the tech supercycle ends (typically triggered by an energy shock such as we have been experiencing for the last year), this hierarchy begins to invert. Chemicals outperform the market, Business Equipment underperforms, and the market as a whole is weak.
The following table shows the correlations between relative performances, as well as the absolute performance of an equal-weighted index of sectors, which is a good proxy for broad indices like the S&P 500 (SPY).
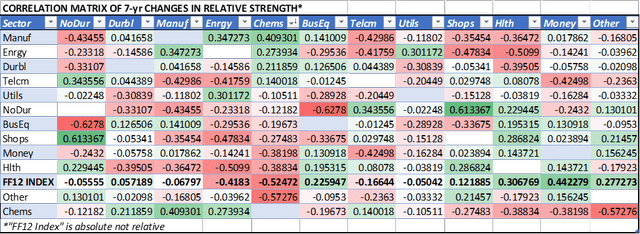
Chart F. Strong Chemicals stocks have tended to be bad for the market. (Own calculations from Fama-French data)
The long-term relative performance of the Chemicals sector has a strong negative correlation with market performance generally, while being modestly correlated with other cyclicals like Manufacturing, Energy, and Durable Goods.
History suggests that, as the sectoral hierarchy inverts, Chemicals are likely to benefit at the expense of the market as a whole. What I call “Baumol sectors”, sectors that have benefited most from the cost disease phenomenon of the last century are likely to underperform. These are sectors most closely connected to consumer goods and services. But, that is a story for another article.
As with energy and industrials, large-cap Chemicals stocks have often seen their greatest periods of outperformance during bear markets in the wider indices. For Chemicals, this appears to have occurred especially in the opening stages of the respective bear markets (for example, the early 1970s and early 2000s), but also throughout the Depression. This Depression-era outperformance may have been due in part to a one-off revolution in consumer-oriented chemicals technology that was already in full swing before the Depression began.
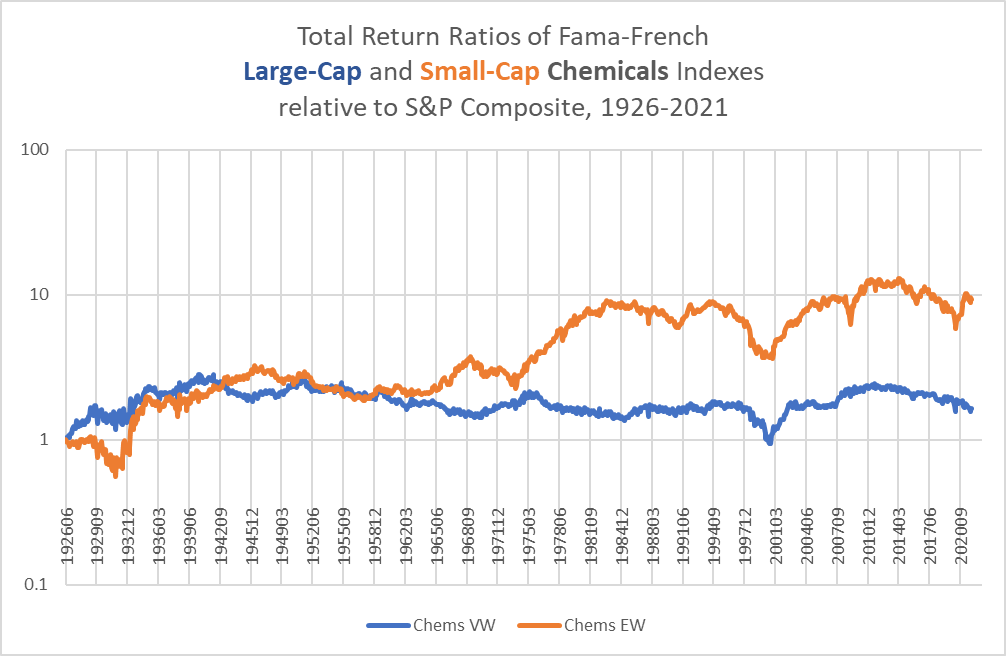
Chart G. Large-cap Chemicals stocks tend to track with the S&P 500 over the very long term. (Own calculations from Fama-French and Shiller data.)
As the following chart shows, however, that outperformance did not spare it the wrath of a general collapse in equities.
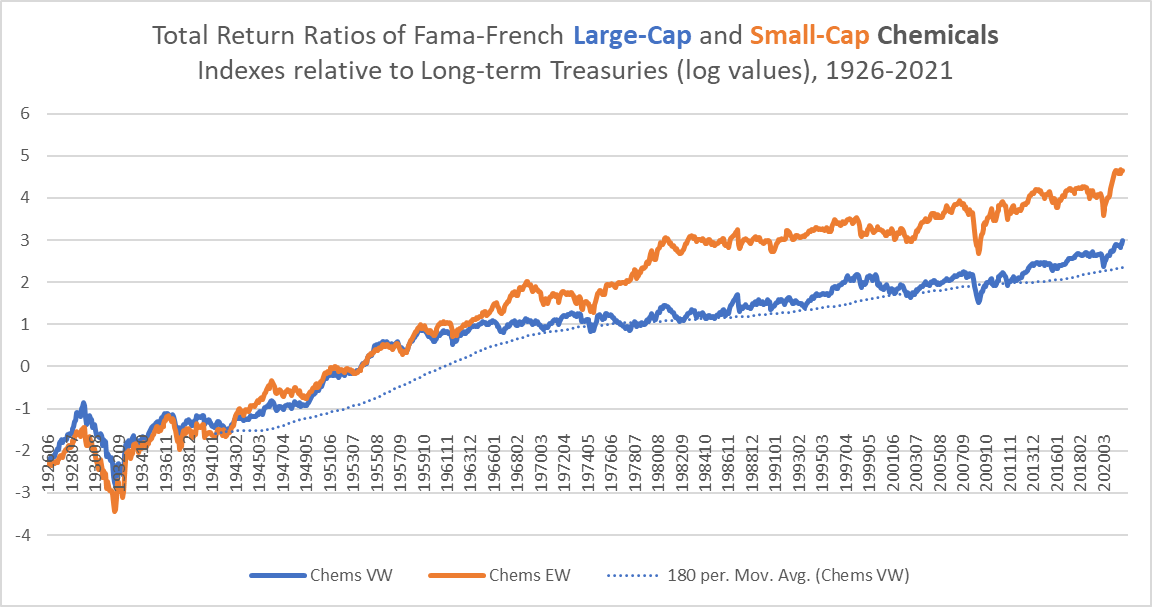
Chart H. Large-cap Chemicals stocks have grown at a steady rate relative to Treasuries since the 1960s. (Own calculations from Fama-French data, Shiller data, and St Louis Fed.)
Once they bottomed, they rose quite rapidly until levelling off in the 1960s to grow at a relatively constant long-term rate.
The performance of the XLB seems to reflect the patterns of the Chemicals index, although the moves are not nearly as dramatic as those seen in the energy sector.
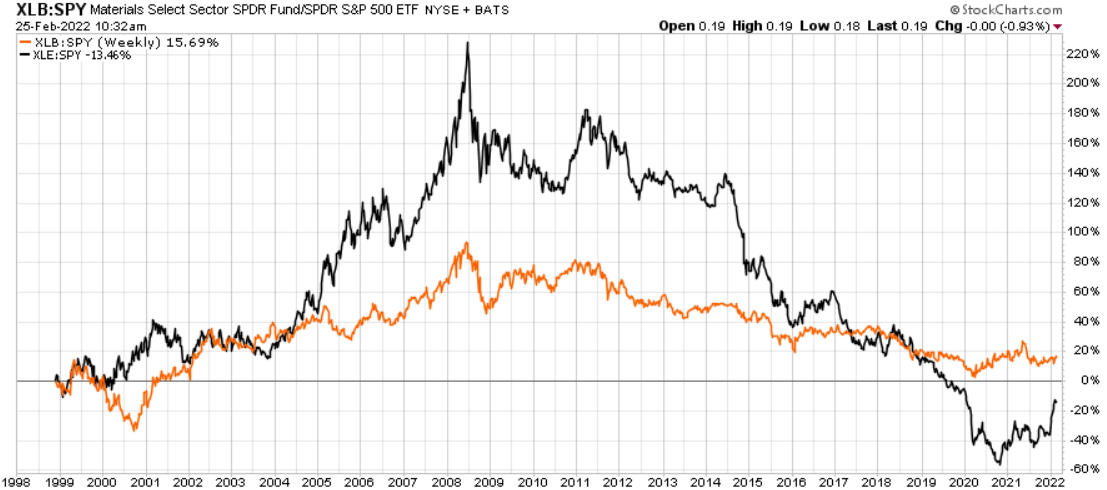
Chart I. XLB tracks both with the Fama-French Chemicals index and the XLE (Stockcharts.com)
Valuations in the Materials Sector
One fairly strong predictor of long-term returns in the Chemicals sector has been the dividend yield, which has fallen to near all-time lows, implying nearly flat returns through the remainder of the decade.
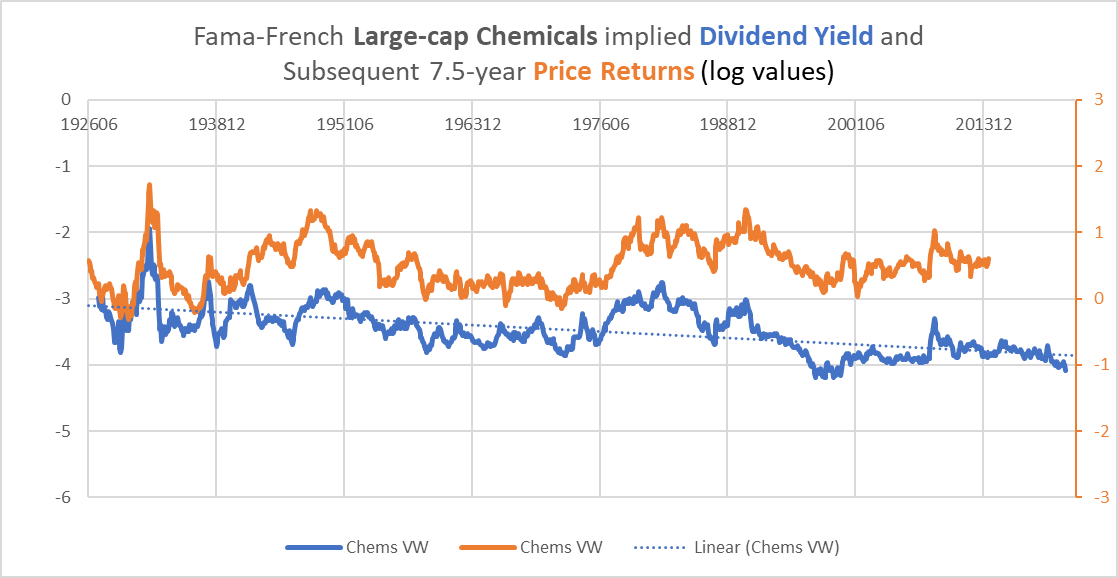
Chart J. The dividend yield has been a strong predictor of long-term Chemicals returns. (Own calculations from Fama-French data)
The dividend yield on Chemicals at the end of 2021 was 1.7%. The yield for XLB is currently near 1.8%, according to Seeking Alpha.
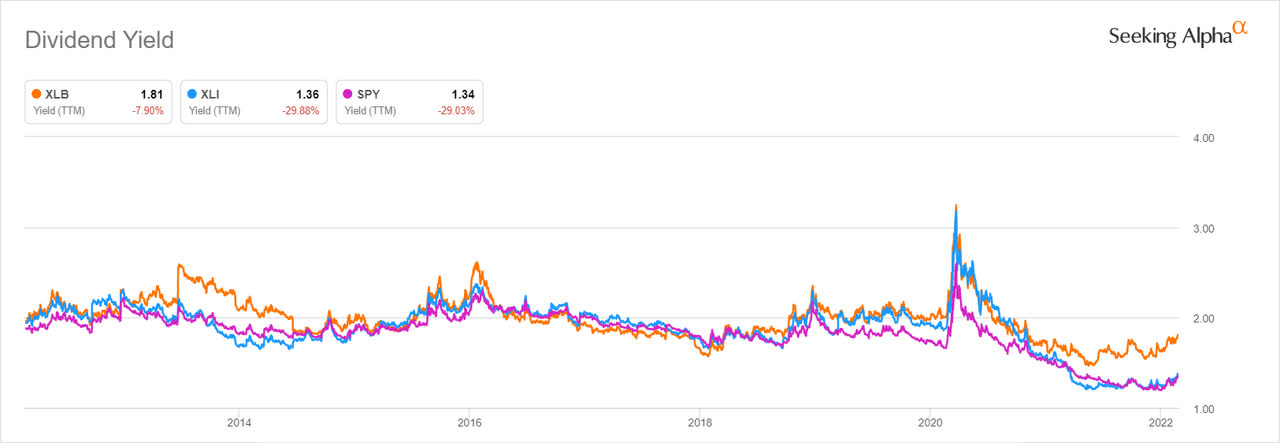
Chart K. The XLB dividend yield is roughly in line with that of the Chemicals index. (Seeking Alpha)
The PE ratio for XLB has generally tracked with the S&P 500 for the last decade, according to data from S&P Global.
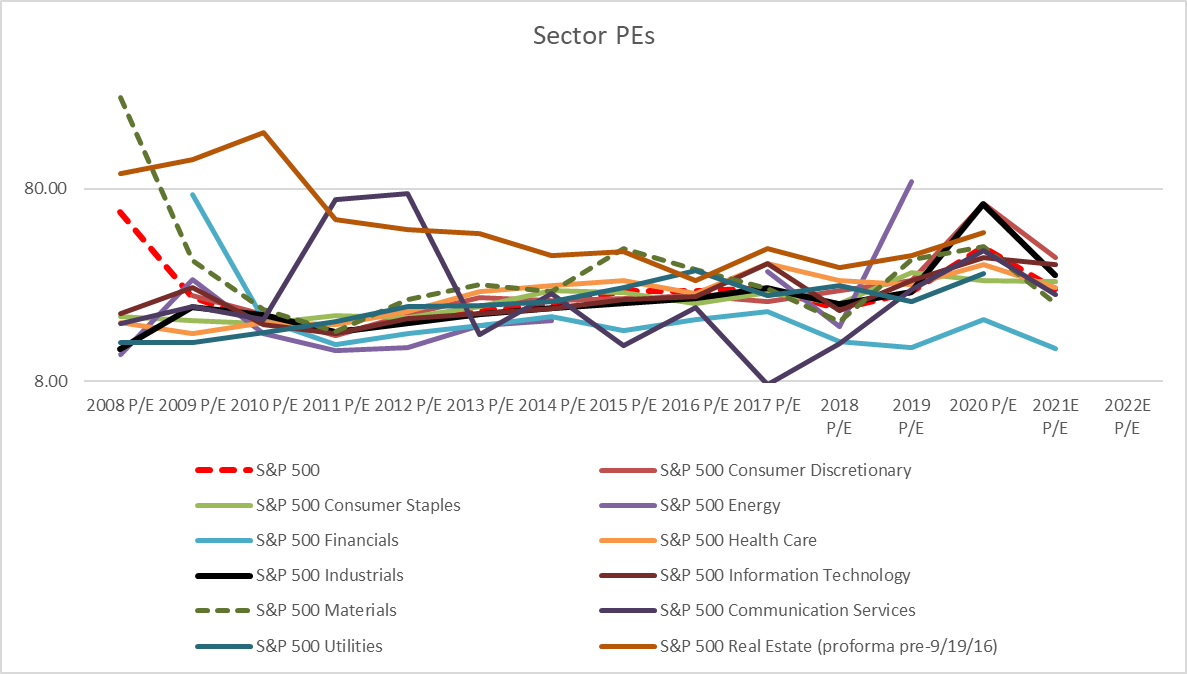
Chart L. XLB’s PE ratio has been in line with the wider market’s. (S&P Global)
At the end of 2021, PE for the Materials sector stood at 20.3 compared to the S&P’s 22.6.
Since we do not have long-term historical PE data for these sectors, the implied dividend yields of the Chemicals sector have to suffice, but the combination of PE data over the last decade and the dividend yield data over the last century suggests that Chemicals and XLB are overvalued on a historical basis.
On top of that, chemicals stocks have been showing greater cyclical weakness.
Cyclical weakness (and some strength) in materials stocks
The following chart from Seeking Alpha shows 1-year total returns for the Fertilizers & Agricultural Chemicals Index (in orange), the Commodity Chemicals Index (in blue), the Industrial Gases Index (in fuchsia), the Specialty Chemicals Index (in green), and the XLB (in red).
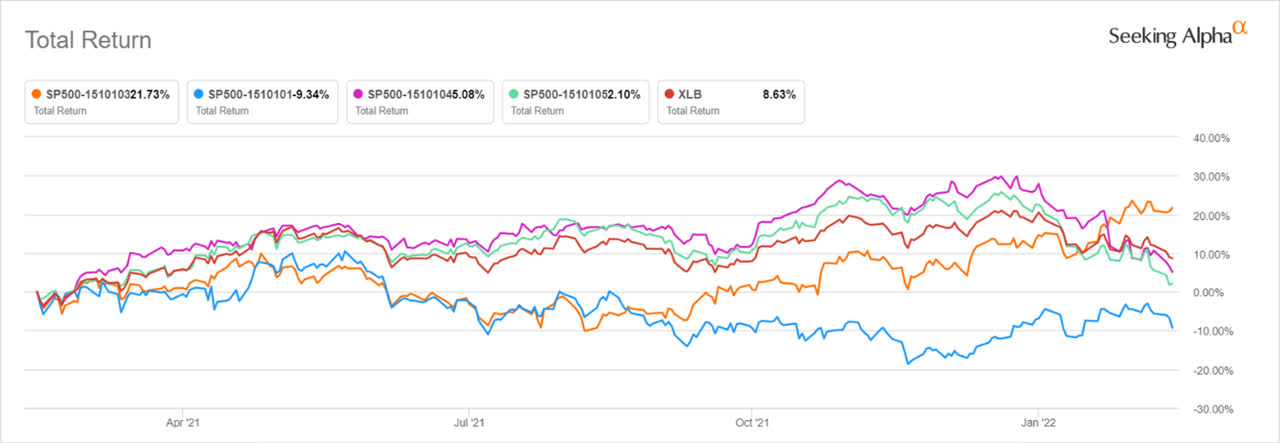
Chart M. Within the S&P 500 Chemicals Industry, the Fertilizers subindex continues to show strength. (Seeking Alpha)
As we saw earlier, Specialty Chemicals and Industrial Gases together comprise 50% of the XLB by weight, and they are both closer to where they were 52 weeks ago than they were 52 days ago.
What is providing resistance to that downside move within the chemicals complex is the Fertilizers & Agricultural Chemicals Index, which is comprised of fertilizer companies like Mosaic and CF Industries. The current surge in fertilizer prices has only been third behind the shocks in 1973 and 2008, which is a boon to companies in this subindex but historically a curse to everybody else.
The chart below is based on World Bank Pink Sheet data.
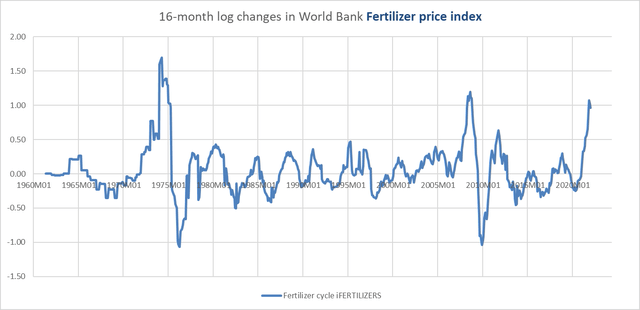
Chart N. Fertilizer prices have been skyrocketing. (World Bank)
If we juxtapose the performance of the Fertilizers subindex with the chart we showed earlier of XLB performance at the industry level, we find resistance to the downside move emanating from Metals & Mining, i.e., the industry tied most closely to the rampant metals commodity inflation of the last two years.
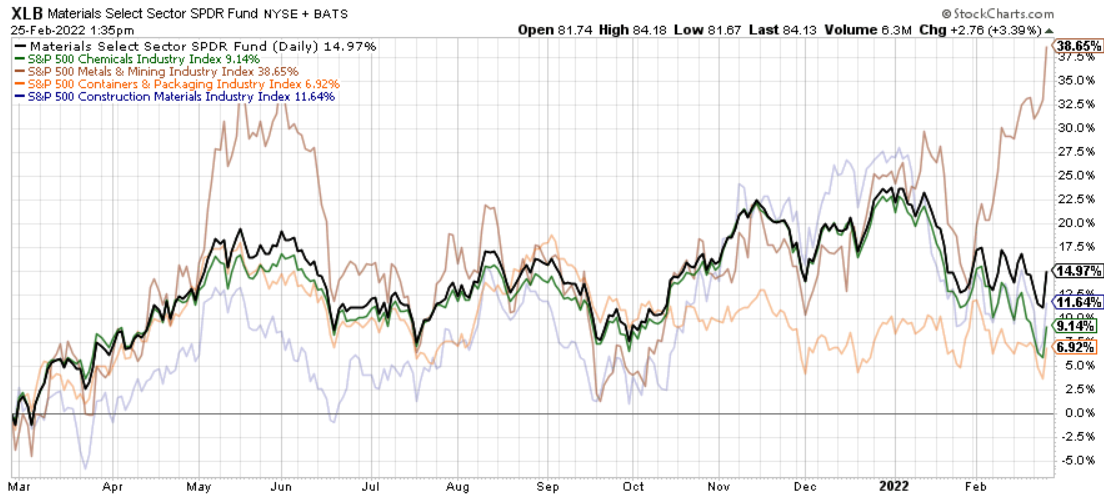
Chart O. Commodity inflation is boosting certain elements of the XLB. (Stockcharts.com)
We saw in XLI, in the article linked to in the first paragraph, that its exposure to service-oriented, tech-like industries was adding to downward cyclical pressure. In this case, however, XLB’s exposure to commodity cycles is helping resist the downward cyclical pressure being experienced in its core.
XLB’s commodity exposure is likely to provide better protection, in this environment, than XLI’s tech-lite exposure, at least for as long as the rally in commodities holds up.
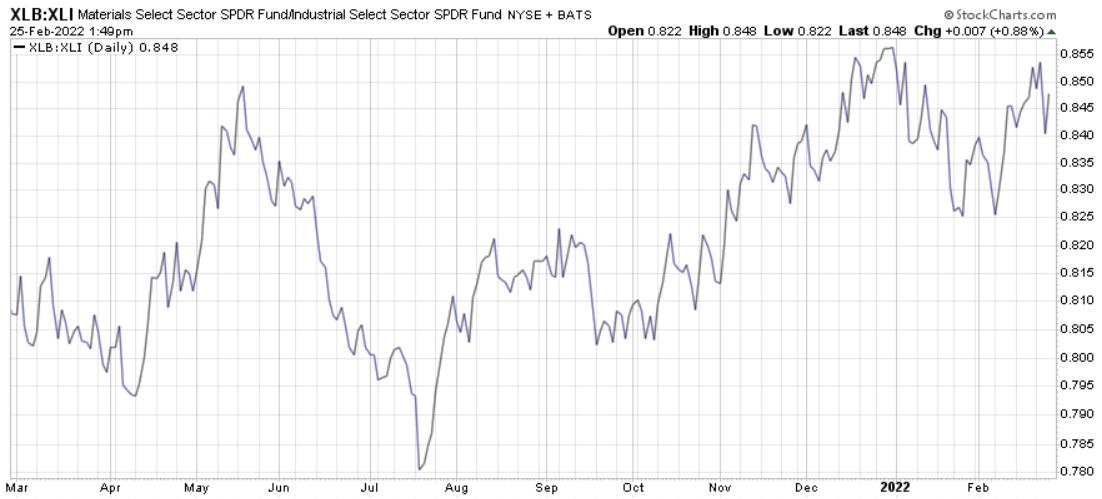
Chart P. In the battle of cyclical sectors, momentum remains on XLB’s side relative to XLI. (Stockcharts.com)
Although I do not have the intestinal fortitude to bet against commodities when they are this hot, I would not count on this commodity cycle to last much longer. I suspect that, in this cycle, the slowdown in the core cyclical equity sectors and industries is the leading edge of a broader cyclical downturn that will spread to commodities, other equity indices, and long-term Treasuries.
In other words, the commodity boom will cannibalize itself through demand destruction.
Gold is one important indicator. If the current gold rally fails, expect industrial metals and fertilizer prices to fall and bring down not only the Metals & Mining and Fertilizers & Agricultural Chemicals indices but the rest of the market, as well. Gold tends to anticipate inflation rather than respond. If it pulls back, that likely indicates a slump is on the way.
Renewed strength in long-term Treasuries is another indicator.
Once weakness spreads to commodities, especially industrial metals, energy, and fertilizers, the cycle will have exhausted itself, and the support XLB has received from its commodity exposure will turn into a drag.
Conclusion
The materials sector, including both the chemicals and metals industries, is likely to outperform most of the other equity sectors, especially the “Baumol sectors” – tech and consumer-oriented stocks – over the course of the 2020s, but this is unlikely to prevent the sector from suffering low to negative returns through the remainder of the decade or from avoiding a cyclical downturn over the next two years.
Over the course of a cyclical downturn, long-term Treasuries (TLT) are likely to be the safest haven, but shifting to sectors that are less cyclically sensitive like consumer staples (XLP), utilities (XLU), or healthcare (XLV) might serve as temporary backstops as we wait to see just how the cycle turns.
Editor’s Note: This article discusses one or more securities that do not trade on a major U.S. exchange. Please be aware of the risks associated with these stocks.
[ad_2]
Source links Google News

