[ad_1]
By Emily Doak
Almost everyone can name a sports team that always seems to be “in-the-hunt” for the playoffs, or a superstar athlete that has dominated his or her field for decades.
Sometimes fund managers make similar claims about their ETFs’ performance by touting their star-ratings, analyst recommendations or sky-high since-inception returns. Even though funds are required by the U.S. Securities and Exchange Commission (SEC) to include warnings that past performance is not a guarantee of future success, it’s difficult to ignore the performance information displayed prominently in charts and graphs, and, like sports fans, investors sometimes get caught up in the excitement swirling around a “winning” fund.
Chasing performance
“Performance chasing” is when an investor chooses a particular fund based largely on the returns it generated in a prior period. In 2007, the SEC warned investors about performance chasing when selecting mutual funds, and we believe this warning is equally applicable to ETFs. Investors who choose funds primarily for their strong track records are often disappointed.
Case study #1: EMQQ
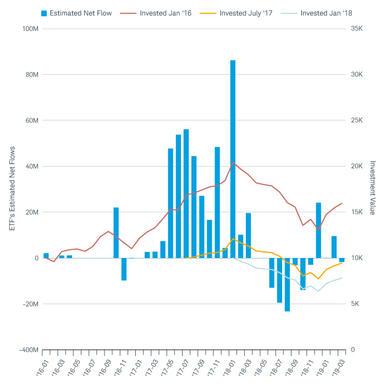
For example, the Emerging Markets Internet & Ecommerce ETF (NYSEARCA:EMQQ) was launched in November 2014. During its first two years in existence, EMQQ’s performance was choppy, and the fund had only $40 million in assets as of the end of October 2016. However, in 2017 and early 2018 the fund experienced a period of positive performance. Its strong returns during this period seem to be correlated with the substantial inflows that followed. Between January 2017 and March 2018, investors added nearly $430 million in net inflows. At its peak, in January 2018, EMQQ’s net assets were over $521 million.
While a hypothetical investor who bought $10,000 worth of EMQQ shares in January 2016 (well before the fund went viral) would have had an investment valued at nearly $16,000 at the end of Q1 2019, a performance chaser who invested $10,000 during the months with the biggest net inflows (July 2017 and January 2018) would have had an investment valued at only $9,456 or $7,813, respectively, as of March 31, 2019.
Performance and flows for Emerging Markets Internet and Ecommerce ETF

Source: Charles Schwab Investment Advisory with data from Morningstar Direct. Data from 01/01/2016 through 3/31/2019. This chart represents hypothetical $10,000 investments in EMQQ made on 1/1/2016, 7/1/2017 and 1/1/2018 and held through 3/31/2019. Calculation of total return is based on monthly net asset value (NAV) with the reinvestment of all income and capital gains distributions. This example does not include transactions fees or commissions. Past performance is no guarantee of future results. The blue bars represent Morningstar’s estimated net flow. Morningstar estimates net flows for ETFs by computing the change in shares outstanding.
The table below shows performance for EMQQ as of March 31, 2019. While most of the returns below are positive, the dates over which they were calculated do not reflect the negative returns experienced by investors who bought shares during the months with the largest inflows.
Performance report for EMQQ as of March 31, 2019
| Three month | Year to date | One year | Three year | Since inception | |
|---|---|---|---|---|---|
| Net asset value (NAV) | 22.24% | 22.24% | -16.38% | 14.26% | 5.92% |
| Market Price | 23.10% | 23.10% | -16.74% | 14.20% | 5.93% |
Source: EMQQ Fact Sheet. Data as of 3/31/2019. Periods greater or less than one year are annualized.
Case study #2: SLVP
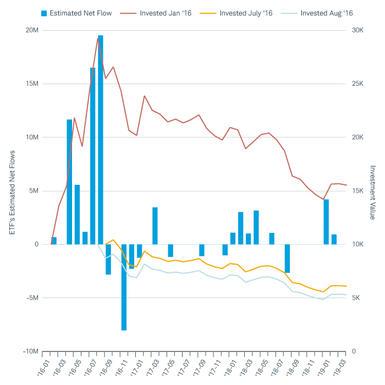
Another example of performance chasing can be seen in the iShares MSCI Global Silver Miners ETF (NYSE:SLVP) where strong performance in 2016 attracted outsized inflows. The fund drew in over $50 million between February and September 2016. While a hypothetical investor who bought $10,000 of SLVP shares in January 2016 would have had an investment valued at over $15,500 at the end of March 2019, a performance chaser who invested $10,000 during either July or August 2016 (the months with the biggest net inflows) would have seen the value of their investment decline to $5,309 or $6,097, respectively, by March 31, 2019 (see chart below). Needless to say, investors looking for a triple-digit repeat of 2016 have probably been disappointed.
Performance and flows for iShares MSCI Global Silver Miners ETF (SLVP)

Source: Charles Schwab Investment Advisory with data from Morningstar Direct. Data from 01/01/2016 through 3/31/2019. This chart represents hypothetical $10,000 investments in SLVP made on 1/1/2016, 7/1/2016 and 8/1/2016 and held through 3/31/2019. Calculation of total return is based on monthly net asset value (NAV) with the reinvestment of all income and capital gains distributions. This example does not include transactions fees or commissions. Past performance is no guarantee of future results. The blue bars represent Morningstar’s estimated net flow. Morningstar estimates net flows for ETFs by computing the change in shares outstanding.
As you can see in the table below, only SLVP’s average annualized performance for the three-year period is positive.
Performance report for SLVP as of March 31, 2019
| One year | Three year | Five year | 10 year | Since inception | |
|---|---|---|---|---|---|
| NAV | -9.21% | 4.79% | -3.84% | N/A | -11.80% |
| Market price | -9.33% | 5.01% | -3.75% | N/A |
-11.72% |
Source: SLVP Fact Sheet. Data as of 3/31/2019. Past performance is no guarantee of future results. Periods greater than one year are annualized.
How to avoid chasing performance
Here are few pointers to help you step up your game and avoid the performance pitfall:
- Don’t discount diversification: It’s nearly impossible to predict which sector will perform well in a given year based solely on past performance, and even more difficult to say which industry (a sub-grouping within a sector) may outperform. ETFs tracking broader indexes may have a less exciting story behind them, but their greater diversification should reduce their volatility compared to niche funds.
- Understand the metrics: If you choose to consider past performance when making an investment decision, take a careful look at how that past performance is reported. Annualized returns are the average, annual return an investor would have received in any year during the total time period with the effects of compounding included in the calculation. Funds are required to report one, five and 10-year returns (or since inception for those without sufficient history). However, other measures of performance are sometimes included alongside these figures and can be confusing. Here are a few performance metrics to watch out for:
- Cumulative returns for periods longer than 1 year. These total, compounded returns for a longer time period may look impressive – and they should! The fund has had more time to perform in the market, and, mathematically, these numbers are similar to a sum rather than an average.
- Alternatively, a fund may show annualized performance for a very short time period – this assumes that high performance during a very short time period (perhaps as little as a single month) continues at the same level for an entire year.
- Finally, look for unusual dates, including returns shown “since inception,” which will vary between most funds (unless they were coincidentally launched on the same day), which can make comparisons between funds challenging.
- Balance past performance with other investment considerations: Management fees, tracking error, bid-ask spread, risk (or volatility), and correlation with the other investments in your portfolio should also be considered when you select an ETF.
Finally, while no one can guarantee that your portfolio will end up in the “hall-of-fame,” knowing when to take past performance with a healthy dose of skepticism may help you avoid jumping on the bandwagon for today’s hot ETF only to be left with a fund that you’d rather cut from the team.
Editor’s Note: The summary bullets for this article were chosen by Seeking Alpha editors.
[ad_2]
Source link Google News

