[ad_1]
It’s time to discuss industrials (XLI) since my most ‘recent’ article on it was written back in October of 2018. The reason why I am just now covering industrials again is because everything played out the way I expected. In this article, I am going to update the situation and tell you why industrials are once again in a very tricky situation.
Note that I mean the SPDR Select Sector Industrial ETF when I am talking about “industrials”. This is the most active industrial ETF and the best tracker of the S&P Industrial Index.

Source: KPMG International
What Happened?
As I just mentioned, it’s a while back since I wrote my last industrials article. So, chances are small you know what I discussed back then. Essentially, what I discussed back then are the odds of a peaking economy.
However, I am not at all advising anyone to start shorting industrials. Especially, not if you are in stocks for the long run. I am just saying that it is likely to see further underperformance of industrials. The best times to own these kinds of stocks are behind us which will put pressure on ratios like the one I just showed you.
The ratios I am mentioning in the quote above are ratios that compare the industrials ETF XLI to less cyclical ETFs. The purpose of this is to see how traders are positioning themselves. Underperforming industrials, generally speaking, mean that we are in a RISK OFF scenario where traders are reducing risks.
I am going to show you these indicators in this article as well. I am just going to start with something we need to discuss first.
What I am going to start with is a graph of the ISM manufacturing index. This index is a leading economic index that tells us what we can expect in terms of hard economic growth like industrial production, new durable goods orders, shipments, and many more. What we see is that growth did decline at the end of 2018 which continued well in Q1 of this year. It’s a terrible trend and I am only glad because the growth peak call turned out to be right because it means my indicators still work.
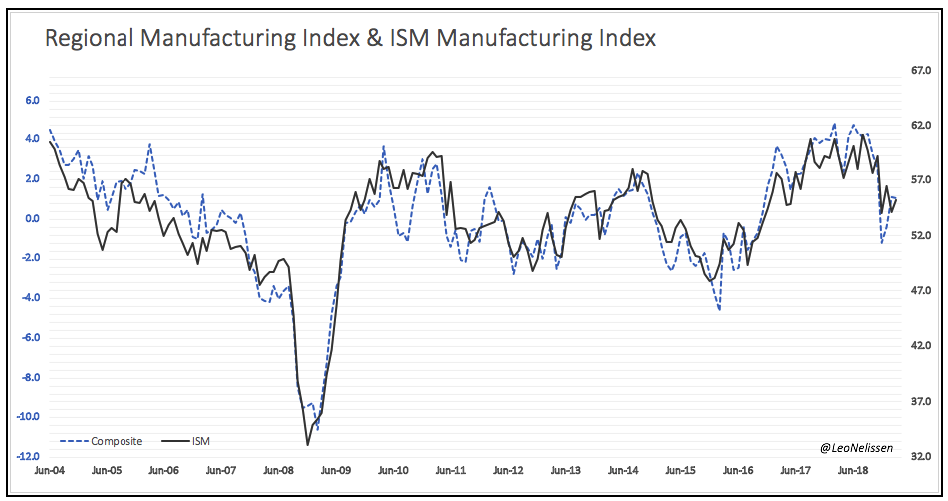
Anyhow, March came in a bit stronger than February. The ISM index increased from 54.2 to 55.3. This is not at all a signal that everything is fine. It could still be a small break on the way down as I discussed in this article. I highly recommend you to read it if you can spare a few minutes.
Now, let’s move over to the next graph. Below, you see three lines. The blue line displays the ISM manufacturing index. The black line displays the industrials ETF XLI, while the red line displays the first ratio spread of this article. The red line represents the ratio spread between industrials and consumer staples (XLP).
The first thing that strikes is the massive implosion of the ratio between industrials and consumer staples in Q4 of 2018. This is exactly what I meant when I said I expected the pressure to increase. As soon as growth starts to peak, investors start to buy ‘non’-cyclicals with money they get from selling cyclicals. Another thing that strikes is that industrials already priced in a massive growth rebound given the huge gap between XLI and the ISM index.
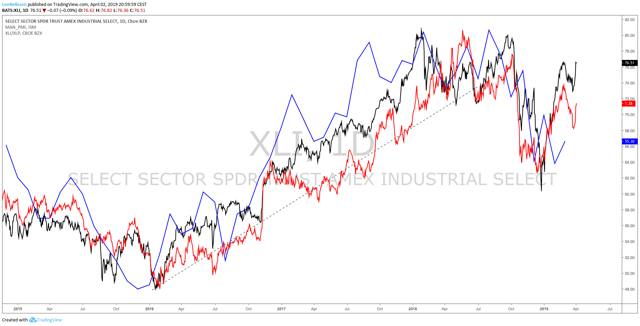
Source: TradingView
The one thing that comes to mind is: this better be a growth bottom…
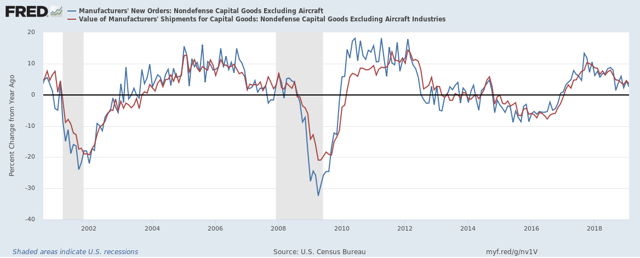
This brings me to the second part of the article. I just said that leading indicators are a powerful tool to predict ‘hard’ economic data. Now, let’s look at the graph below. Year-on-year growth of both manufacturing new orders and shipments has been in a steady decline since the end of 2017. However, real weakness started at the end of 2018 when leading indicators started to decline. At this point, new orders are still at 2.6% growth while shipments are at 3.5% growth. Both numbers are good, but the trend is very ugly. This will end in negative growth territory without a doubt if leading indicators do not quickly start to rebound.
And then there is industrial production. Industrial production growth is still at one of the highest levels since the early 2000s. In this case, growth is at 3.6% which does not at all indicate that growth is slowing. And that might be a problem. I think these levels of growth are highly unsustainable with new orders and leading indicators being in a downtrend. I think it is just a matter of time until we see slower industrial production growth.
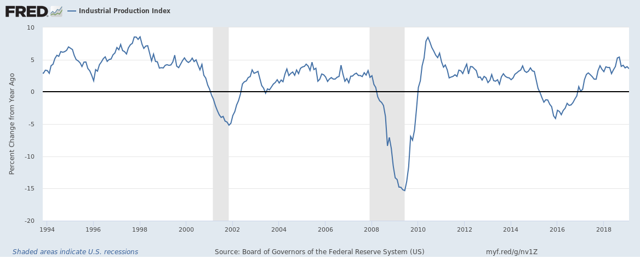
It seems industrials are playing a dangerous game. We are seeing that fundamentals are weakening which could hurt earnings in the second and third quarters. Maybe even beyond. The problem is that industrials have already proceeded to price in a new growth rally which makes owning XLI quite dangerous at this point. It’s not the worst thing in the world given that we are getting first signs that leading indicators might be bottoming, but one should be aware that the risk/reward ratio is all but interesting at this point.
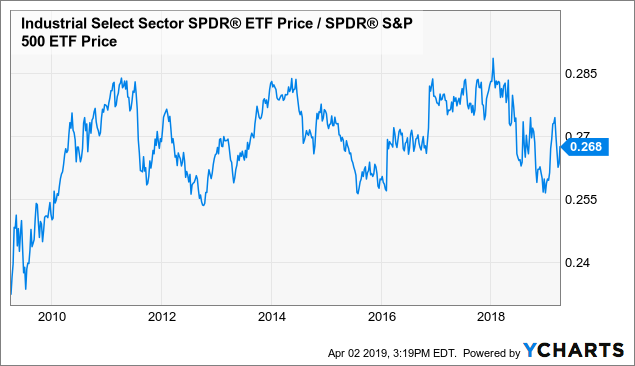
Personally, I expect that further economic weakness will lead to a further underperformance of XLI. I think this index is likely to underperform both the S&P 500 (as seen below) and defensives like consumer staples as I showed you in this article.
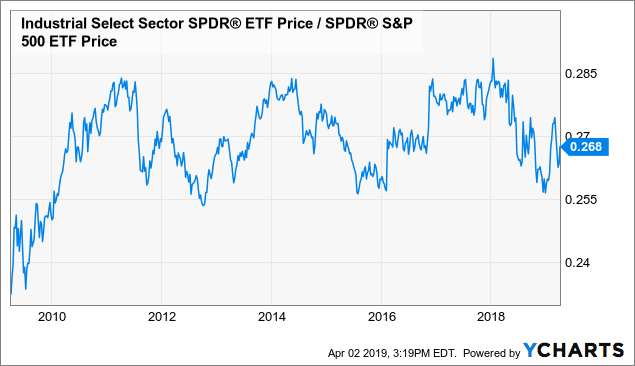 Data by YCharts
However, if leading indicators start to rebound, I think we are going to be in for more XLI strength. This might not happen this month or next month, but I think it’s a good thing to keep an eye on XLI as this ETF allows you to track industrials without having to deal with stock picking or single company risks.
Personally, I am very keen to see how leading indicators are going to behave over the next few weeks. Not only because I need these indicators for my economic outlook but also because I love to trade industrials during upswings.
Stay tuned!
Thank you for reading my article. Please let me know what you think of my thesis. Your input is highly appreciated!
Disclosure: I/we have no positions in any stocks mentioned, and no plans to initiate any positions within the next 72 hours. I wrote this article myself, and it expresses my own opinions. I am not receiving compensation for it (other than from Seeking Alpha). I have no business relationship with any company whose stock is mentioned in this article.
Additional disclosure: Disclaimer: This article serves the sole purpose of adding value to the research process. Always take care of your own risk management and asset allocation.
[ad_2]
Source link Google News

