[ad_1]

Toltek/iStock via Getty Images
Most market participants would likely choose crude oil as the world’s most political commodity. After all, over half the world’s oil reserves are in the Middle East, a highly volatile political region. Even though countries are moving to address climate change by encouraging alternative and renewable fuel sources, fossil fuels continue to provide the most power. A shift to alternative fuels will take decades.
Historically, wheat is the commodity that has caused more political upheaval, wars, and revolutions than any other raw material. Wheat is the primary ingredient in bread, a nutritional staple. The French Revolution began as a bread shortage that cost the last reigning French Queen her head. More recently, the Arab Spring in 2010 that caused the political change to sweep across North Africa and the Middle East began as bread riots in Tunisia and Egypt.
In early 2022, the CBOT wheat price is sitting on either side of $8 per bushel, a level not seen since 2012 before last year. While the market looked up at the $8 level over the past decade, it could be looking down at that price over the coming months as many factors support a rising wheat price. The Teucrium Wheat ETF product (WEAT) follows the price of three actively traded CBOT wheat futures contracts higher and lower.
CBOT wheat futures blast over the $9 per bushel level as the 2022 crop year approaches
Nearby CBOT wheat futures are the grain’s global pricing benchmark, and they rose over the $8 per bushel level for the first time since December 2012 in November 2021.
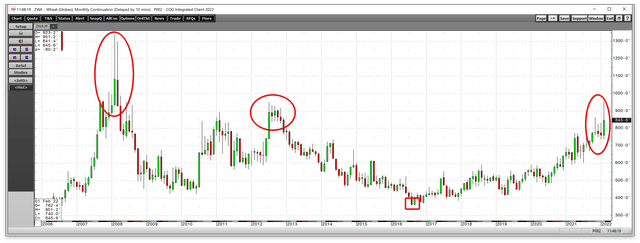
Monthly CBOT Wheat Chart (CQG)
The monthly chart highlights the move to an almost decade high in late 2021. The USDA’s monthly World Agricultural Supply and Demand Estimates report said global wheat stocks were falling in 2021. The latest February WASDE report projected a five-year low in supplies.
Meanwhile, the global population continues to grow at a rate of around twenty million people each quarter. Over the past five years, the world has added about 400 million more mouths to feed. Since wheat is a staple for global nutrition, supplies must keep pace with the ever-increasing demand. As of the end of last week, the worldwide population stood at nearly 7.88 billion people.
The monthly chart illustrates that CBOT wheat futures prices reached a bottom of $3.5950 per bushel in August 2016 and has made higher lows and higher highs over the past almost six years. During the height of the outbreak of the 2020 global pandemic that pushed prices of most assets to lows, CBOT wheat fell to a higher low of $4.6825 per bushel.
Wheat supplies have struggled to keep pace with the growing demand for food. Last week, the price spiked higher to over the $9.50 per bushel for the first time since June 2008. At least four other factors are pushing wheat prices higher, and a move to the 2008 $13.3450 record peak could be in the cards in 2022.
Reason one: Inflation is at the highest level in over four decades- Rising input prices
The global pandemic caused central banks to flood the financial system with a tidal wave of liquidity while governments unleashed a tsunami of stimulus, igniting an inflationary fuse. The latest January 2022 US consumer price index showed that prices rose by 7.5%, with core CPI excluding food and energy moving 6% higher, the highest level in over four decades. The producer price index increased by nearly 10%. While the US central bank prepares to hike short-term interest rates to battle inflation, they are far behind the curve. JP Morgan recently provided the most hawkish and aggressive forecast, calling for nine twenty-five basis point Fed Funds rate hikes until March 2023, putting the Fed Funds Rate at 2.25%. If inflation remains at the current level, it will take over thirty twenty-five basis point increases to push real short-term rates into positive territory.
The highest inflation rate in decades means that input prices for wheat producers have soared. Energy, land values, fertilizers, labor, financing costs, transportation expenses, farm equipment, and all other costs for producing a bushel of wheat are rising, putting upward pressure on the grain’s price. Inflation is a challenging beast to tame. Rising inflation erodes the US dollar’s purchasing power, causing increasing commodity prices, and wheat is no exception. Moreover, since wheat is an essential ingredient in the foods that provide nutrition, it is uniquely sensitive to rising inflationary pressures.
Reason two: Russia is the world’s lead wheat producer – War in Ukraine is bullish for the grain
The world’s leading wheat exporting country is Russia.
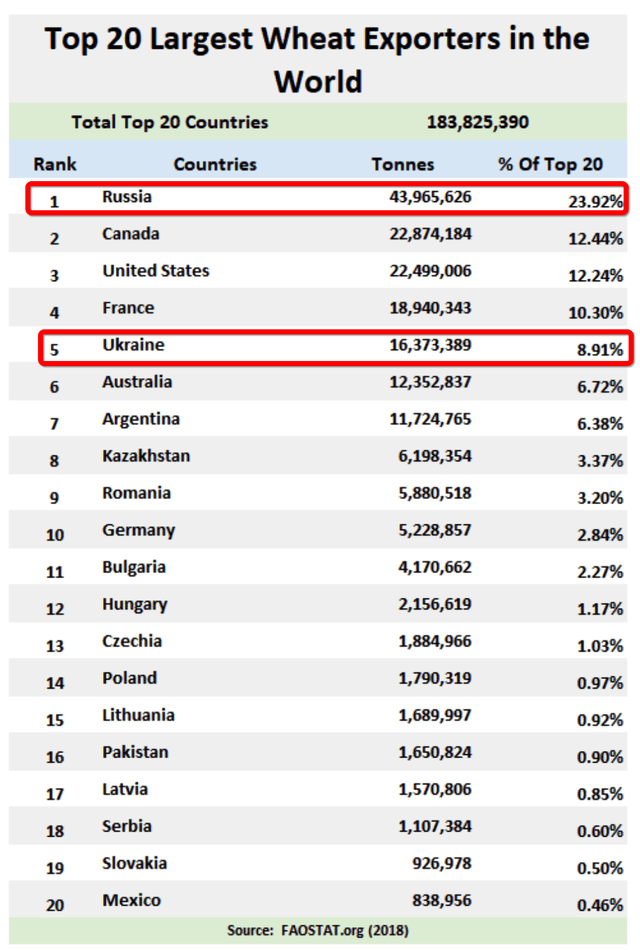
Leading wheat exporting countries in 2018 (beef2live.com)
The chart shows Russia and Ukraine accounted for 32.83% of the world’s wheat exports in 2018. War in Ukraine between the two countries is turning wheat acreage into battlefields.
Moreover, six countries border the Black Sea and the critical shipping ports for wheat and other grains such as corn and barley. Ukraine, Russia, Georgia, Turkey, Bulgaria, and Romania all have borders on the Black Sea, increasing shipping risks as Russia and Ukraine battle for control of the country. Even if agricultural production continues during a war, Russia could retaliate against the US and European sanctions by embargoing wheat production, causing a severe grain shortage with global stocks at a five-year low.
Reason three: Consumers are likely to panic – The KCBT-CBOT wheat spread is a sign of increasing hedging activity
In what could become a feeding frenzy, wheat consumers are likely to scramble to hedge requirements in a rising market. Many US bread manufacturers price their wheat supplies based on the KCBT hard red winter wheat futures contract, which is less liquid than the CBOT soft red winter wheat futures.
Over the past decades, the average spread between the two kinds of wheat has been a 20-30 cents per bushel premium for KCBT wheat. The premium tends to rise with consumer hedging activity and fall when consumers purchase requirements on a hand-to-mouth basis.
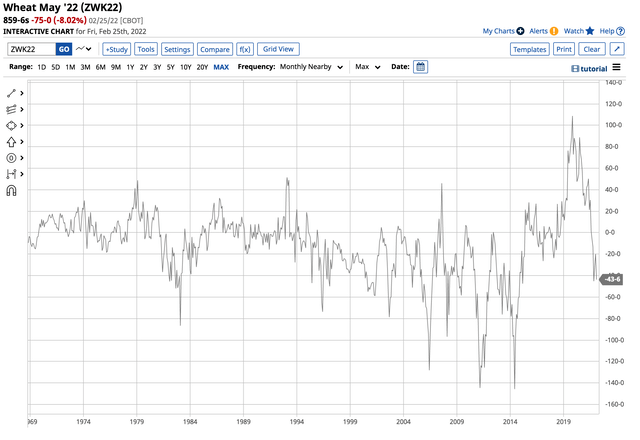
CBOT-KCBT Wheat futures (Barchart)
The long-term chart reflects the differential of the nearby KCBT wheat minus the nearby CBOT wheat spread. The spread peaked at an all-time high of a $1.4475 per bushel premium for KCBT wheat in 2011 when the price was on its way to the 2012 $9.4725 peak. In 2006, when wheat was heading for its all-time high, the spread moved to a $1.2825 premium for the KCBT wheat.
As CBOT wheat prices declined from 2012 through 2016 and stabilized with an upward bias from 2016 through 2020, consumers remained on the sidelines and did not rush to hedge requirements. As the chart shows, CBOT wheat traded at a premium to the KCBT wheat, with the low for the KCBT wheat in November 2019 at $1.0875 per bushel. Since then, the spread has moved back to a premium for the KCBT hard red winter wheat and was sitting at over the 40 cents per bushel level at the end of last week. The spread trend is higher, and it moved above the top end of the long-term norm. Consumers are hedging in the current environment, and the war between Russia and Ukraine could cause the buying to accelerate, pushing wheat prices and the KCBT premium back to levels not seen since 2014.
The bottom line is the trend in the KCBT-CBOT wheat spread is telling us that wheat prices are heading higher and could challenge the 2012 and 2008 highs.
Reason four: The technical trend is higher, and the trend is always your best friend
Global wheat stocks, consumer hedging activity, population growth, and a war impacting production are fundamental reasons why wheat’s rally may only be getting underway. As Russia moved into Ukraine, unleashed attacks on Kyiv, the capital, and Ukrainian leaders pledged to defend and fight, wheat prices took off on the upside, probing above the 2012 high.
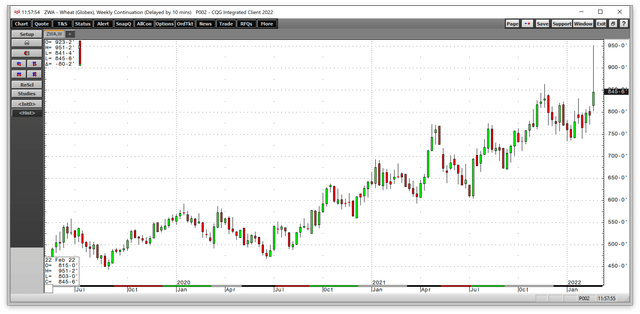
Weekly CBOT Wheat Futures Chart (CQG)
The week chart illustrates the highly bullish trading pattern in the wheat futures arena. Last week’s rally came on the back of the war between Russia and Ukraine will impact the global supplies. Wheat is rallying during the end of the 2022 winter before farmers plant their crops for the coming year. The situation in Eastern Europe could mean those crops will not materialize as Europe’s breadbasket becomes minefields instead of the soil that produces the wheat and other agricultural products that feed the world. Even if crops grows, Russian control could mean it will not move to consumers worldwide.
More than the price of wheat is at stake in Eastern Europe. Wheat shortages have a long history of creating political change. In his February 21 speech, President Putin spent a long time documenting his view of history and Ukraine’s connection to Russia. Meanwhile, the Russian leader also knows that governments that cannot feed their people tend to lose power. The world has witnessed government change and civil uprisings when wheat availabilities decline, and prices rise. Most recently, the Arab Spring changed governments in North Africa and the Middle East.
Aside from the supply and demand fundamentals and wheat’s political history, the price trend is higher before the first seeds go into the ground for the 2022 crop. Wheat prices could move a lot higher over the coming weeks and months as technical factors and fundamentals are creating an almost perfect bullish storm.
The most direct route for a risk position in the wheat market is via the futures and options market. The most liquid wheat futures market is the CBOT soft red winter wheat contracts on the Chicago Mercantile Exchange. Market participants looking to participate in rising wheat prices without venturing into the volatile and leveraged futures arena can turn to the Teucrium Wheat ETF product (WEAT). The most recent top holdings of WEAT include:
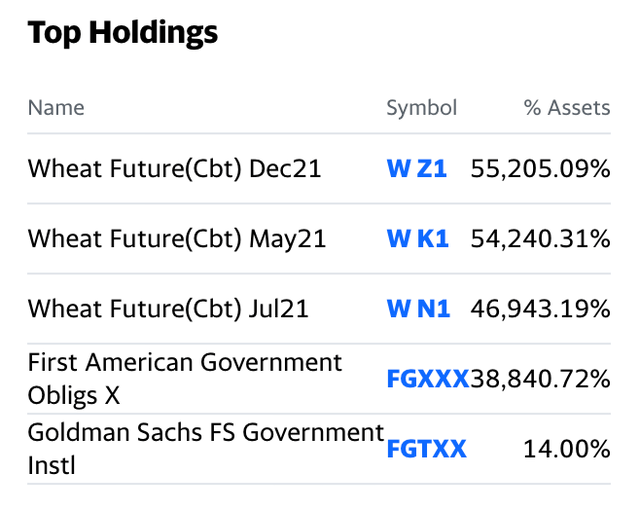
Top Holdings of the WEAT ETF Product (Yahoo Finance)
The listed holdings are stale as the ETF typically holds three CBOT wheat futures contracts. The fund description highlights how the ETF limits the number of rolls from one contract to another as they expire:
The Teucrium Wheat Fund provides investors unleveraged direct exposure to wheat without the need for a futures account. WEAT provides transparency to investors by investing in a known benchmark (described below), listing all holdings nightly, and providing future roll dates. WEAT was designed to reduce the effects of rolling contracts (and contango and backwardation) by not investing in front-month (spot) futures contracts and thus limiting the number of contract rolls each year. Includes all expenses paid by the Fund, including the management fee, as presented in the Form S-1 dated July 15, 2016.
Source: Fund Summary for the WEAT ETF Product (Barchart)
According to Barchart, at $8.11 per share, WEAT had $119.212 million in assets under management. The ETF trades an average of over one million shares each day and charges a 1.91% management fee.
The most recent rally in the nearby CBOT wheat futures market took the grain’s price from $7.40 on February 3, 2022, to a high of $9.5125 last week or 28.5% higher.
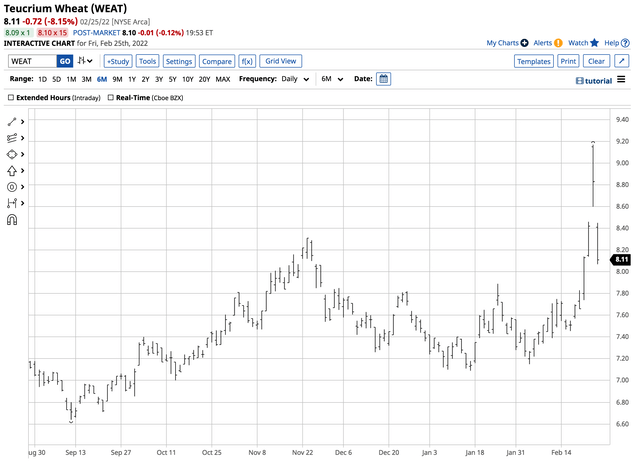
Chart of the WEAT ETF Product (Barchart)
Over the same period, the WEAT ETF rose from $7.15 to $9.17 per share or 28.3%, as the ETF did an excellent job tracking the CBOT wheat price.
The wheat price looks set to move appreciably higher over the coming weeks and months, but bull markets rarely move higher in a straight line. Buying WEAT on a correction could be the optimal approach for participating in the bullish fundamental and technical trends in the commodity that feeds the world, with Russian and Ukrainian production controlling nearly one-third of the world’s exports.
[ad_2]
Source links Google News

