[ad_1]

mesut zengin
On February 28, I wrote an article for Seeking Alpha, “WEAT- 4 Reasons That Can Propel This Wheat ETF Higher.” On that day, the WEAT ETF closed at $8.84 per share. The four compelling reasons for the bullish piece were inflation, Russia and Ukraine, consumer panic, and the technical trend.
The wheat ETF exploded higher, reaching $12.75 per share only days later, on March 4, 2022. In that article, I wrote, “The wheat price looks set to move appreciably higher over the coming weeks and months, but bull markets rarely move higher in a straight line. Buying WEAT on a correction could be the optimal approach for participating in the bullish fundamental and technical trends in the commodity that feeds the world, with Russian and Ukrainian production controlling nearly one-third of the world’s exports.” On August 12, the WEAT ETF was lower than the February 28 price, at around $8.40 per share. The correction could create another opportunity for investors and traders, as the issues that took CBOT wheat futures to an all-time high in March have not disappeared. The Teucrium Wheat Fund (NYSEARCA:WEAT) provides an alternative to the CBOT wheat futures contract for market participants looking for exposure to the grain that feeds the world.
CBOT Wheat Futures Correct
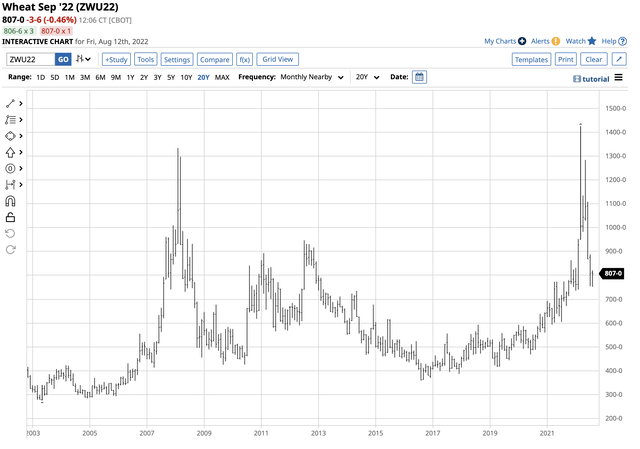
Shortly after the February 28 article, nearby CBOT wheat futures exploded to a record high.

September CBOT Wheat Futures Contract (Barchart)
The chart highlights the move that eclipsed the 2008 $13.3450 all-time peak in March 2022 that took nearby CBOT soft red winter wheat futures to a new peak at $14.2525 per bushel. Bull markets rarely move in straight lines, and the higher prices rise, substantial corrections tend to occur. The wheat futures turned lower in March, reaching the latest low of $7.52 per bushel in August. As of August 12, the price was just over $8 per bushel, the highest level since 2012.
Meanwhile, on Friday, August 12, the US Department of Agriculture released its latest August World Agricultural Supply and Demand Estimates report, the gold standard for producers and consumers for many agricultural product fundamentals. The WASDE told the wheat market:
WHEAT: The outlook for 2022/23 U.S. wheat this month is for increased supplies, higher domestic use and exports, and reduced stocks. Supplies are raised on higher production with all wheat production forecast at 1,783 million bushels, up 2 million from last month. Reductions in winter wheat and Durum are more than offset by an increase in Other Spring Wheat. The all wheat yield is 47.5 bushels per acre, up 0.2 bushels from last month. Food use is raised 6 million bushels to 970 million, based primarily on the NASS Flour Milling Products report, issued August 1. The report indicated record wheat flour millings in the April-June quarter, which resulted in raising 2021/22 food use to a record 972 million bushels. Wheat exports for 2022/23 are increased 25 million bushels to 825 million with most of the upward adjustment for Soft Red Winter and White, based on competitive export prices. Projected 2022/23 ending stocks are lowered 29 million bushels to 610 million. The projected 2022/23 season-average farm price (SAFP) is reduced $1.25 per bushel to $9.25. This is based on prices received for marketings to date, which are lower than previously expected. However, the SAFP is still projected at a record, surpassing $7.77 per bushel in 2012/13. The global wheat outlook for 2022/23 is for higher supplies, greater consumption, increased trade, and fractionally lower stocks. Supplies are raised by 4.2 million tons to 1,055.9 million as higher production more than offsets reduced beginning stocks. Production is increased to a record 779.6 million tons, primarily on higher production for Russia, Australia, and China. Russia’s production is raised 6.5 million tons to a record 88.0 million on both higher harvested area and yield. Harvested area increased for both winter and spring wheat on updated area data from Rosstat, Russia’s statistical agency. Winter wheat yields are raised on harvest results while spring wheat yields increased on generally favorable conditions to date. Australia’s production is raised 3.0 million tons to 33.0 million as increasingly favorable weather conditions indicate higher yield prospects. China’s production is increased 3.0 million tons to 138.0 million tons on the National Bureau of Statistics summer grain report, primarily on higher harvested area. Partially offsetting these increases are reductions for India and the EU. India’s production is lowered 3.0 million tons to 103.0 million, primarily on reduced harvested area. EU production is reduced 2.0 million tons to 132.1 million, mostly on reductions for Hungary, Spain, and Romania. Projected 2022/23 world consumption is raised 4.4 million tons to 788.6 million, led by higher feed and residual use for Russia and Australia. Projected 2022/23 global trade is raised 3.2 million tons to 208.6 million on higher exports by Russia, Australia, Ukraine, Canada, and the United States more than offsetting lower exports from the EU and Argentina. Russia’s exports are raised to a record 42.0 million tons on greater exportable supplies and expectations that export prices will remain competitive. Projected 2022/23 world ending stocks are reduced fractionally to 267.3 million tons and remain at the lowest level in six years.
Source: USDA August WASDE Report
The bottom line is the USDA said US supplies, use, and exports have increased, but stockpiles will decline during the 2022/2023 period. The WASDE also reported that global wheat inventories declined on the back of rising production, consumption, and increased trade. Worldwide wheat inventories fell fractionally to 267.3 million tons, the lowest level in six years.
The USDA made little mention of the most significant factor facing global wheat supplies.
Shortages And High Prices Will Remain
The war in Ukraine and the threat to supplies from Europe’s breadbasket continue to be the main threat to the global wheat market.
I reached out to Sal Gilberte, the founder of the Teucrium family of agricultural commodity ETFs, including the WEAT product, for his take on the latest USDA report. Sal told me:
The August WASDE is always interesting with the USDA giving its first serious yield estimates of the season. Surprisingly, the USDA is projecting a near record US soybean yield, which seems aggressive this early in the growing cycle. Not surprisingly, corn and wheat yield and production estimates have been reduced versus last month across the globe, due primarily to hot, dry weather in parts of the US, the EU, and India. With the notable exception of soybean inventories which are expected to rise this year versus last year, global total grain usage and global total wheat usage will both exceed production this year, meaning global food balance sheets are continuing to tighten for a third consecutive year. It is worth emphasizing that global wheat production, even with this month’s cut in production estimates due to weather events, is projected to be record high, meaning demand is the driver behind shrinking global wheat balance sheets. Farmers are clearly responding to high prices with increased production, but demand seems relatively inelastic, regardless of price, at least thus far. Weather and time will set the future direction of prices from this point onward as we head into the Northern hemisphere’s harvest season.
As Sal highlights, the contraction of the global wheat balance sheet is a significant factor for prices. The longer the war in Ukraine continues, the lower exports from the Black Sea ports will create shortages and keep prices at high levels.
A Wheat Spread Remains Bullish In Mid-August
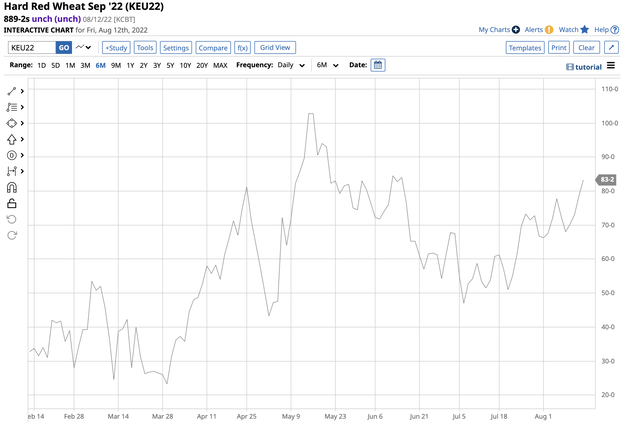
In the February 28 Seeking Alpha article on the wheat market, I highlighted that the long-term average for the KCBT hard red winter wheat versus the CBOT soft red winter wheat spread (the spread) was between a 20 and 30 cents per bushel premium for the KCBT spread. On February 25, 2022, it stood at a 43.75 cents premium, indicating US bread manufacturers and consumers who price their requirements on the KCBT price were actively hedging their price risk.

September KCBT-CBOT Wheat Spread (Barchart)
The chart illustrates the spread on the September contracts has nearly doubled to the 83.25 cents per bushel level, with KCBT wheat at a premium to CBOT wheat on August 12, 2022. The widening of the spread reflects increased consumer price and supply concerns.
Supply Shortages Are The Real Danger
As the world moves towards the 2022 harvest season, lower output from Europe’s breadbasket poses a significant threat to global wheat supplies. The primary ingredient in bread is essential for nutrition. While the US and European consumers will likely experience elevated prices, emerging countries that rely on Russian and Ukrainian wheat and other agricultural products will likely suffer shortages that can lead to malnutrition and starvation.
The world continues to focus on high energy prices caused by the war in Ukraine, but food supplies could be a far greater danger over the coming months and years. With no end in sight, Europe’s breadbasket and the Black Sea ports remain a battlefield.
The WEAT ETF Is Back In The Buy Zone
In a March 7 follow-up article on WEAT on Seeking Alpha, I wrote, “Aside from the war, the price for fertilizers, energy, labor, farm equipment, interest rates, and land values, all inputs for crop production, have skyrocketed, putting upward pressure on prices. Prices are approaching or eclipsing record highs as the 2022 crop season in the Northern Hemisphere begins. The risk of price downdrafts rises with prices as even the most aggressive bull markets rarely move in straight lines. Be careful in the grains. Any risk position requires a plan for risk and reward levels.”
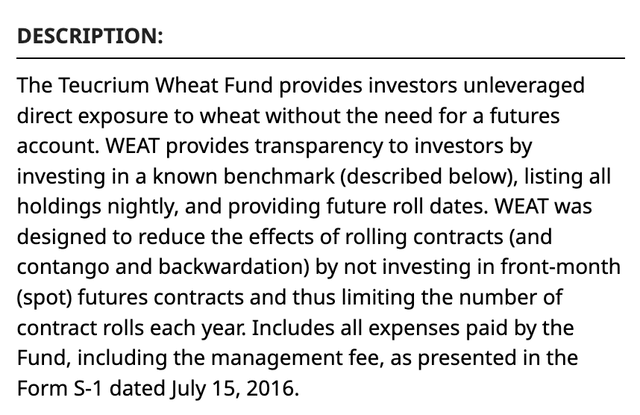
Wheat futures have declined to the $8 level after trading about $14 per bushel at the high. The most direct and liquid route for a risk position in the wheat market is the futures and futures options trading on the CME’s CBOT division. The Teucrium Wheat Fund (WEAT) is the only ETF that tracks the CBOT wheat price. WEAT’s fund summary states:

Fund Summary for the WEAT ETF Product (Barchart)
At $8.37 per share on August 12, the WEAT ETF had $326.022 million in assets under management. WEAT trades an average of over 1.6 million shares daily and charges a 1.14% management fee. WEAT holds an average of three actively traded CBOT wheat futures contracts. Since most price volatility occurs in the nearby futures contract, WEAT tends to underperform the active month CBOT wheat futures contract on the upside and outperform during price corrections.

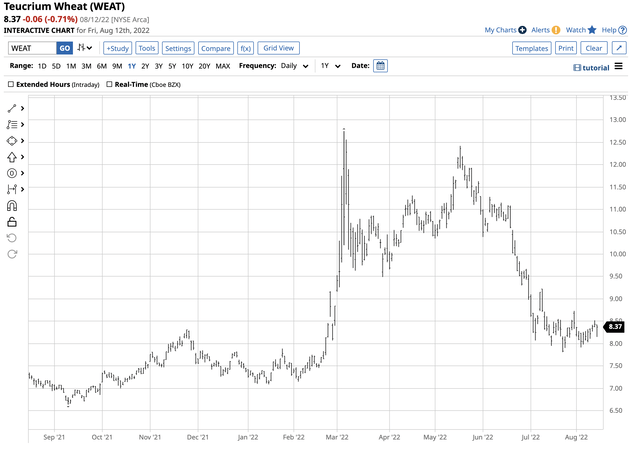
Chart of the WEAT ETF Product (Barchart)
The chart shows the WEAT ETF peaked at $12.75 on March 4 and dropped to a low of $7.81 on July 22, 2022. At the $8.37 level on August 15, WEAT is closer to the low than the early March high. Meanwhile, wheat futures have declined on the back of Russian wheat shipments, but supplies from Europe’s breadbasket depend on the ongoing war. Wheat prices remain at the highest level in a decade at over $8 per bushel, and the potential for future price spikes to the upside remains high. WEAT’s correction to the level where it was trading in late February could present a compelling opportunity for the coming weeks and months. The KCBT versus CBOT wheat spread suggests that the odds continue to favor the upside in the agricultural product that feeds the world.
[ad_2]
Source links Google News

