[ad_1]

McKevin/iStock via Getty Images
Introduction
A recent article I wrote explained the importance of dividend income during periods of market volatility, such as in the present situation. Many investors are revisiting dividend investing through safe and diversified funds, such as the Vanguard International High Dividend Yield ETF (NASDAQ:VYMI). Therefore, while it is worth waiting out the market’s volatility, by investing in dividend funds, some of these funds provide a low dividend yield such as VYMI. It is worth exploring the case for VYMI and whether some special qualities can compensate for its low single-digit dividend yield.
Higher interest rates may cause a substitution from VYMI to other alternatives like bonds
Typically, investors buy an investment for either income yield, capital gains, or a combination of both. Today, as interest rates rise, many investors are reconsidering the “yield” aspect of their investments, and in the equity market, the most common and tangible “yield” is the dividend yield, whereby investors can look forward to either cash or reinvestment of dividends.
Since dividend yields are often low (i.e. single digit percentage yield), dividend investors tend to be sensitive to interest rate changes. In other words, dividend investors prefer that dividends from an investment provides sufficient return on investment or meets some income producing criteria, otherwise they may switch to competing investments.
Today, funds such as VYMI are under threat due to the risk of substitution with higher yielding investments, particularly from the bond markets which have been pummeled this year (i.e. valuations on bonds have become a lot more attractive and compelling). The two charts below show the VYMI dividend yield and the Moody’s Baa-rated bond yields (we can take this as a good proxy for the corporate bond market’s yield since it draws from the middle of credit ratings, bordering investment grade and high yield). What’s striking about the chart is that bond yields are now higher, and not only that, is close to its peak, whereas the dividend yield of VYMI is still quite far from its peak. In fact, the Baa corporate bond yield is close to providing 1% more than the VYMI dividend yield (close to averaging 4% over the last 12 months). While this “yield only” measure does not account for potential capital gains in VYMI, it gives a gauge a very important measure of income return that dividend investors seek and helps us assess the risk of investors moving funds out of VYMI in search of greener pastures.
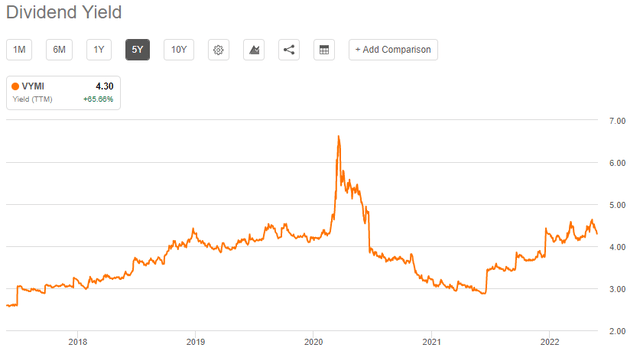
VYMI historical dividend yield trend (Seeking Alpha)
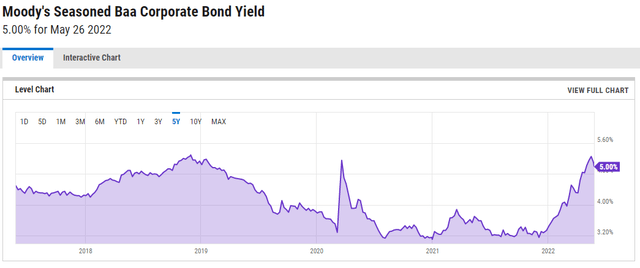
Moody’s Baa Corporate Bond Yield (YCharts)
Dividend variability
Risk averse dividend investors (e.g. those whom invest in high quality equities such as the stocks which VYMI holds) tend to prefer predictability in dividends. However, the chart above on the dividend yield trend indicates the dividend yield of VYMI has significant variability, ranging from 2.9% to 6.6% over the last 5 years. Therefore, investors in VYMI cannot expect the 12 months trailing yield of more than 4% to stay where it is. In fact, the latest quarterly dividend yield at $0.31 was near its historical low; the chart below shows this and further corroborates the concern with VYMI’s variability of quarterly dividends. The forward yield expectation is for the dividend yield to fall below 2%, according to Seeking Alpha data. This is not good news when the US Treasury yield is already above 2%.
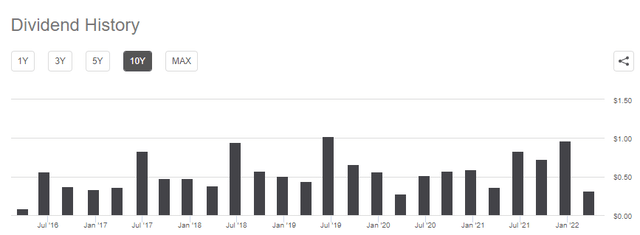
Quarterly dividends of VYMI (Seeking Alpha)
VYMI is well-diversified but has some exposure to emerging markets risk and a severe underweight on tech
An article I wrote about ETO explained that its huge exposure to the financial sector will do well in a period of rising interest rates, and VYMI also bears the same characteristic. However, the difference between VYMI and ETO is that VYMI has zero exposure to the US, 5.6% exposure to China and 3.0% exposure to Brazil (1Q2022 fund factsheet), while ETO focuses on developed economies’ exposure. This is a risk since rising US rates will lead to a stronger US Dollar that means depreciation for developing markets’ currencies. VYMI also has a minimal 2.9% exposure to Technology which can be risky since part of the capital gains of a fund such as VYMI depends on its index exposure, of which the tech sector is major (22% of the MSCI world index and 7% of the FTSE All-World ex US High Dividend Yield Index which VYMI tracks). Tech companies are currently not expensive and it might be a better idea if VYMI was not so severely underweight the tech sector.
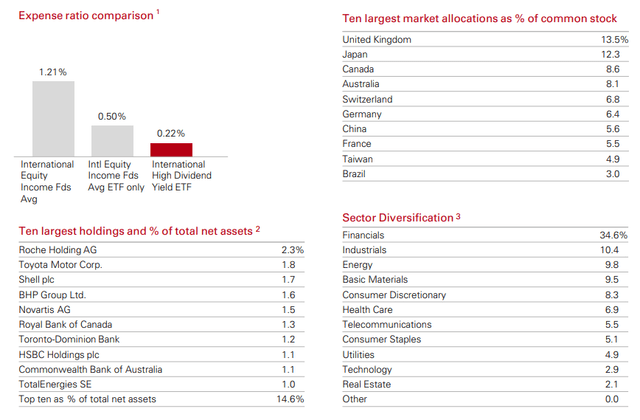
VYMI fund diversification and key characteristics (Vanguard)
The underexposure of VYMI to tech also suggests VYMI focuses on investing in the companies of yesteryear. Such companies include TM, oil majors RDS and SHEL and the large banks such as RBC, TD, and HSBC. There are also allocations to NVS and Roche, not exactly the up and coming companies in biotech. What I see are largely traditional, safe companies, but that would also mean a fund that is not seeking alpha; this is further compounded by the high degree of diversification (the largest holding was merely 2.3% of the portfolio, in Roche Holding AG).
VYMI tracks the index, suggesting no intention to outperform
VYMI tracks the FTSE All-World ex US High Dividend Yield Index. Therefore, VYMI does not intend to outperform, hence the high degree of diversification which means a non-committal view to individual stocks. Unfortunately, this non-committal strategy also means underperformance against more actively managed dividend funds such as VYM, VIGI, HDV, DNL, IQDG (see chart below). Of this list, VIGI, DNL and IQDG are also broad international dividend ETFs but performance has been better than VYMI.
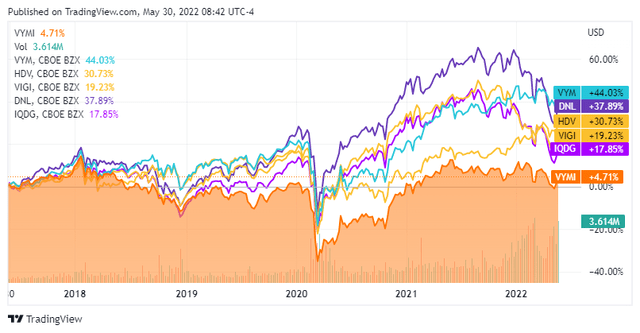
VYMI performance against peers (Seeking Alpha)
Conclusion
VYMI invests in a sample of established companies from the FTSE All-World ex US High Dividend Yield Index. As such, VYMI diversifies into developing economies although present volatility and rising US interest rates do not bode well for emerging markets. VYMI has a favorable sector exposure, mainly in financials, that is well-placed to gain from the upswing in interest rates. However, VYMI will benefit little from any potential rise in the tech sector where prices were already pummeled. Furthermore, VYMI has underperformed several broad international dividend funds. VYMI’s dividend yield is not high at slightly above 4% in the last 12 months and have been variable, with a range of 2.9% to 6.6% over the last 5 years. The forward dividend yield is forecasted to fall below 2% (Seeking Alpha data) and its quarterly dividend payments are volatile – the quarterly dividend dropped from $0.96 to $0.31 from 4Q2021 to 1Q2022.
[ad_2]
Source links Google News

