[ad_1]
Epiximages
Thesis
The Vanguard High Dividend Yield ETF (NYSEARCA:VYM) and iShares International Select Dividend ETF (BATS:IDV) are both popular among dividend investors. As their names suggest, they provide convenient access to high dividend stocks in the U.S. domestic and international markets, respectively.
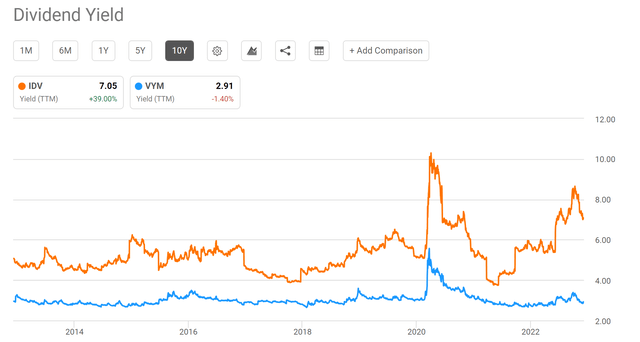
I have been monitoring VYM regularly and have written quite a few articles on it in the past. However, IDV recently showed up on my radar because its yield surged to be close to the highest level in a decade as you can see in the chart below. To wit, its past yield has been range bound between 4% and 6% for most of the time during the past decade. Yet currently, it’s yielding 7.05%, not only substantially above the historical range but also close to the highest level (only second to the ~10% range observed during the peak of the COVID fire sale). In contrast, as we’re going to elaborate on later, VYM is still trading at a premium relative to its historical record despite the price corrections it suffered this year.
Such a stark contrast certainly piqued my interest and motivated the comparison in the remainder of this article. You will see that IDV’s past performance is certainly no comparison to VYM: both in terms of total returns and volatility risks. Although under current conditions, IDV’s valuation discount is too large to ignore, and it also offers a few other advantages too, especially for investors whose exposure is primarily U.S.-oriented.
Source: Seeking Alpha data
VYM and IDV: Basic information
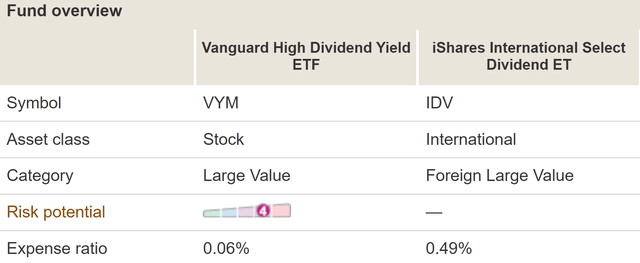
First, a quick intro to readers who are not familiar with these funds. Both are popular dividend ETF funds. VYM holds about 500 (503 to be exact) domestic companies with a total AUM of $48.7B. IDV holds exactly 100 foreign companies with a total AUM of $3.9B. In terms of expense ratio, VYM charges 0.06%, and IDV charges 0.49%. The more fundamental differences are in their indexing method as quoted from their fund descriptions below (slightly edited by me).
VYM summary: VYM seeks to track the performance of the FTSE High Dividend Yield Index, which measures the investment return of common stocks of companies characterized by high dividend yields. It provides a convenient way to track the performance of stocks that are forecasted to have above-average dividend yields. It follows a passively managed, full-replication approach.
IDV summary: IDV seeks to track the investment results of an index composed of relatively high dividend-paying equities in non-U.S. developed markets. It provides exposure to established, high-quality international companies. And it provides access to developed market stocks that have provided consistently high dividend yields over time. It can be used to expand income strategies to international markets.
Source: The Vanguard Group

Source: The Vanguard Group
VYM vs IDV: A closer look at the discount
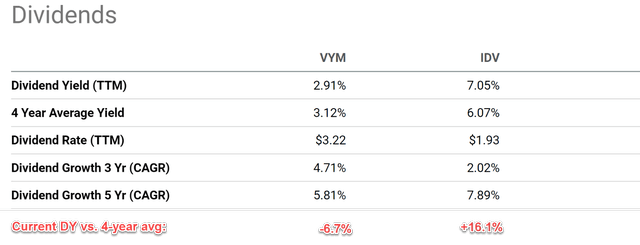
After the above intro, let’s get back to the valuation discount that piqued my interest in the first place. As you can see from the following chart, VYM is currently yielding 2.91%. And to provide a historical context, its average yield in the past four years has been 3.12%. As a result, the fund is currently yielding 6.7% BELOW its historical average over the past 4 years, suggesting a valuation premium.
In contrast, IDV has been yielding 6.07% on average in the past four years. And as a result, its current yield of 7.05% is 16.1% above its historical average, signaling a large valuation discount.
Source: Author based on Seeking Alpha data
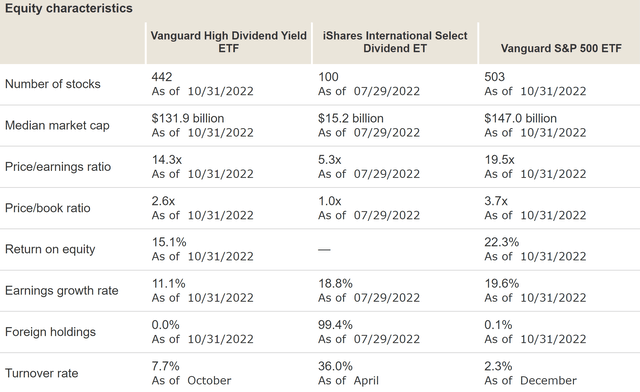
The valuation discount is even more dramatic by other metrics besides dividend yield. As you can see from the following table, IDV’s valuation multiples are significantly lower than VYM (which in turn is lower than the overall U.S. market represented by VOO). To cite a few numbers, IDV’s P/E ratio is only 5.1x, only about 1/3 of VYM’s 14.3x, and almost a ¼ of VOO’s 19.5x. In terms of price-to-book value ratio, IDV’s current multiple is only 1.0x, again close to 1/3 of the 2.6x of VYM and ¼ of the 3.7x from VOO.
Source: The Vanguard Group
IDV’s disadvantages
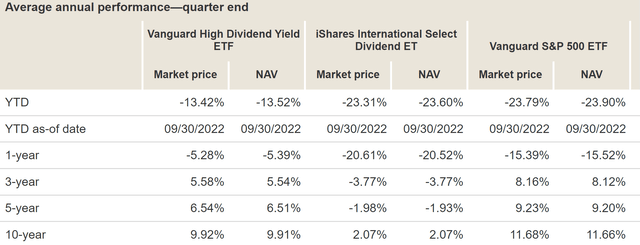
The above valuation discounts in IDV certainly come with some disadvantages. As you can see from the chart below, the overall return of IDV compares miserably to VYM and also VOO in the past. To wit, in the past 10 years, IDV has delivered a total return of 2.07% CAGR, lagging VYM’s 9.92% by almost a whole 8% and VOO’s 11.6% by almost 9%.
Source: The Vanguard Group
To make the picture even worse, IDV also suffered larger volatilities than both VYM and the overall U.S. market. As you can see from the chart above, take the volatility risk in the past year as an example, IDV suffered a total correction of -20.61%, far exceeding the -5.28% correction suffered by VYM and the -15.39% correction suffered by VOO. Broadening the timeframe a bit longer, VYM’s volatility is on par with VOO as reflected by its 1.0 beta value shown below. While in contrast, IDV’s volatility risk is about 20% above both VYM and VOO as reflected by its beta value of 1.2.

Source: The Vanguard Group
IDV vs VYM: let’s look at the trees
The differences in their valuations multiples and risks are of course rooted in their fundamental holdings.
Firstly, the holdings in VYM are much larger in scale than IDV. If you recall from an earlier chart, the median market cap of VYM’s holdings is $131.9 billion (which is about the same as that in the VOO, $147.0 billion). In contrast, the median market cap of IDV’s holdings is only $15.2 billion, only about 1/7 of that for VYM.
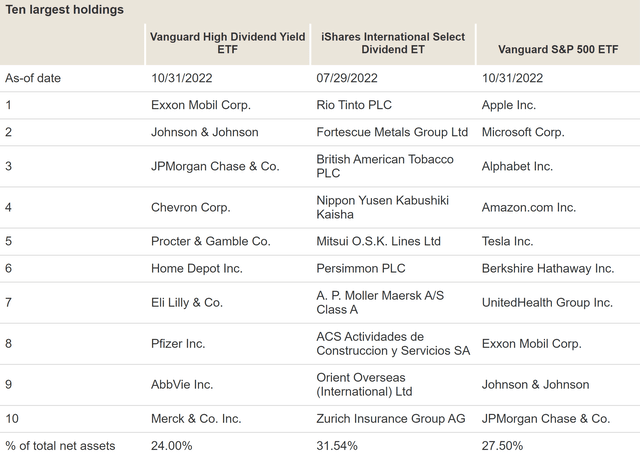
Secondly, when we took a closer look at the individual holdings, as displayed in the chart below, we can see that the holdings in IDV just do not have the same scale, brand name, and profitability compared to those in VYM.
I am familiar with and also hold some of IDV’s top 10 holdings (such as RIO and BTI). And I know they are quality businesses that also happen to provide a high current dividend yield. But as a group, I do not see their quality comparable to the likes of XOM, JNJ, and JPM.
Source: The Vanguard Group
Risks and final thoughts
To recap, IDV’s valuation discount is too large to ignore under current conditions. In terms of dividend yield, VYM is trading at ~6.7% premium relative to its 4-year historical average yield, while IDV is trading at a ~16.1% discount. In terms of other metrics such as P/E and P/BV ratios, IDV’s current multiples are only about 1/3 of VYM’s.
Although investors need to be aware of its risks before engaging. IDV’s total return lagged both VYM and VOO by a large margin in the past. IDV has also suffered much higher volatility than both VYM and VOO at the same time. These differences are caused by the difference in their fundamental holdings. And also bear in mind that IDV charges a fee of 0.49%, more than 7x higher than VYM’s 0.06%.
- All told, my final verdict is that IDV’s current valuation discount has properly compensated for these risks. And besides its large valuation discounts, IDV also offers a few other advantages for investors to consider too:
- First, especially for investors whose exposure is primarily U.S.-oriented, IDV offers international exposure as a further diversification. As illustrated in the table below, IDV is correlated to the U.S. market much weaker than VYM (a correlation coefficient of 0.87 vs. VYM’s 0.95).
- Second, IDV’s current 7%+ yield is attractive to investors seeking current income.
- Third, IDV’s current valuation (after all 5.3x P/E is indeed hard to ignore) could lead to a better total return if a valuation reversion occurs.
- And finally, if you recall from an earlier chart, IDV has also featured higher dividend growth in the past 5 years (a CAGR of 7.89% vs. VYM’s 5.81%).

Source: Portfolio Visualizer, Silicon Cloud Technologies LLC
[ad_2]
Source links Google News

