[ad_1]

yorkfoto/E+ via Getty Images
(This article was co-produced with Hoya Capital Real Estate)
Introduction
When comparing ETFs that, by name, invest in the same segment of the equity market, I have found which index they chose to drive their investments can make a big difference in either performance or risk, sometimes both. Sometimes, I converted that research into an article for Seeking Alpha, such as these:
IJS Vs. VBR: Comparing Small-Cap Value ETFs That Use Different Indices
MDY Vs. IWR: The Index Followed Makes A Difference
In both cases, the ETFs generated different results, which then affected what investors earned. In this case, while the Vanguard Total International Stock ETF (NASDAQ:VXUS) and the iShares Core MSCI Total International Stock ETF (NASDAQ:IXUS), are close enough in their statistics, that the deciding factor could by the manager (Vanguard or Blackrock) or index provider (FTSE or MSCI). For those investors looking to add international equity exposure with one ETF, I would rate both as a Buy.
A quick look at the International market
Investing outside one’s home country adds extra risks that need to be considered in setting your timing and/or allocation percentage. These are a few of those to keep in mind.
Currency risk
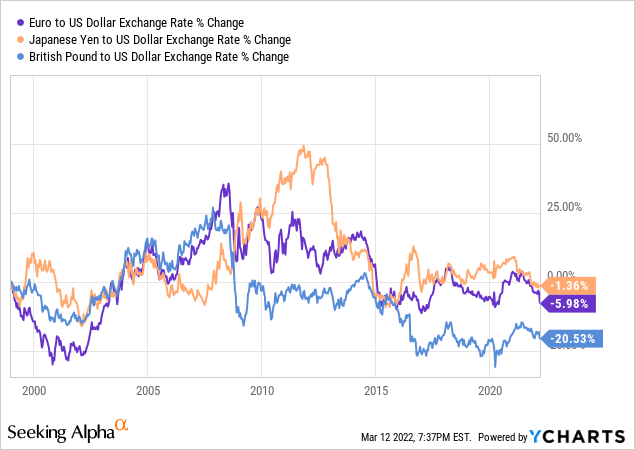
Unless the ETF is hedging against the movement of your currency, the ETF’s performance will be negatively affected when your currency is strong and positively affected when it weakens. The above chart shows movement against three major currencies. International ETFs could have exposure to dozens, not all of which are moving in sync with the USD. My IHDG Vs. IQDG: To Hedge Or Not Your International Dividend ETF article explored this in more detail.
Different GDP Growth Forecasts
Of course these forecasts were made before Russia threw the world’s economy into unknown territory. The final level of Russian energy sanctions will effect inflation and growth rates, which are already being downgraded. Russia and Ukraine are also major exporters of grains.
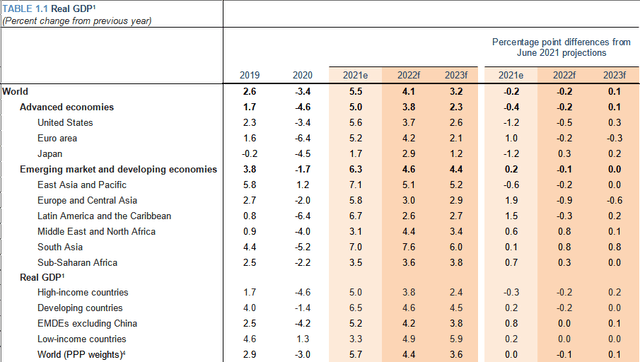
openknowledge.worldbank.org (Jan’22)
While it might not be the case now but before the Ukrainian invasion, Europe was expected to grow faster than the United States in 2022 but not in 2023. All the Emerging Market regions were above both in both forecasted years, so exposure there is important: VXUS has 26% and IXUS has 23.5%. To be consistent, I excluded South Korea, as FTSE considers it Developed. Classifying them as EM would increase that exposure by under 4% for both ETFs.
Market risks
By this, some risks to consider are associated with a country. A prime example is, again, what happened to Russian stocks once those sanctions were applied. While Putin has only threatened so far, nationalization of foreign corporate assets has occurred in the past by other countries. Another risk, listed in Frontier Market ETF prospectus documents is the possibility of currency flow and foreign ownership limits.
Examining the Vanguard Total International Stock ETF
Seeking Alpha describes this ETF as:
The Vanguard Total International Stock ETF is an exchange traded fund launched and managed by The Vanguard Group, Inc. The fund invests in public equity markets of global ex-US region. It invests in stocks of companies operating across diversified sectors. The fund invests in growth and value stocks of companies across diversified market capitalization. The fund seeks to track the performance of the FTSE Global All Cap ex US Index. VXUS started in 1996.
Source: Seeking Alpha
VXUS has $48.6b in assets, with Vanguard charging only 8bps in fees. Investors currently receive a 3.5% yield. Index-based fund evaluation should start with that index.
FTSE Index overview used by VXUS
FTSE describes their Index as:
The FTSE Global All Cap ex US Index is part of a range of indices designed to help US investors benchmark their international investments. The index comprises large, mid and small cap stocks globally excluding the US. The index is derived from the FTSE Global Equity Index Series (GEIS), which covers 98% of the world’s investable market capitalization.
Source: FTSE Russell
The Index contains stocks from almost 50 countries. While now removed, Russia’s 50 stocks were .4% of the Index at the end of February. With the next review scheduled for this month (then September), the next report should have a 0% weight for Russia.
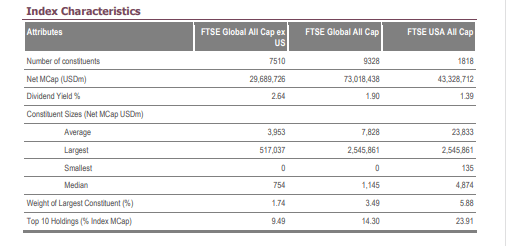
research.ftserussell.com Index
The above chart compares this Index with both the World Index and the US-only Index.
Some index construction rules that apply to this FTSE Index series include:
- Free float: This is the proportion of shares in issue that are deemed to be tradable. The investable weight of a stock is the more restrictive of free float and any applicable foreign ownership restriction. A buffer of +/-3% is applied to limit changes to investable weights.
- Countries: FTSE classifies countries included in its global indices into one of three categories: Developed (26), Advanced Emerging (10) and Secondary Emerging/Frontier (13). FTSE maintains a set of criteria to assess market status and minimum standards for each category for countries and markets to achieve in order to be eligible for that category.
- Excluded assets: Equity funds of any type, Limited Liability Partnerships (LLP), Limited Partnerships (LP), Master Limited Partnerships (MLP), Limited Liability Companies (LLC) and Business Development Companies (BDC).
- Minimum Voting Rights: Companies assigned a developed market nationality are required to have greater than 5% of the company’s voting rights in the hands of unrestricted shareholders. Emerging market securities are not subject to this requirement.
- Liquidity screen: Each security will be tested for liquidity semi-annually in March and September by calculation of its monthly median of daily trading volume. There is a 14-page PDF that explains this process! Existing and non-constituent securities which have not traded on 60 or more trading days during the past year (up to and including the review cut-off date), will not be eligible for index inclusion.
VXUS Holdings review
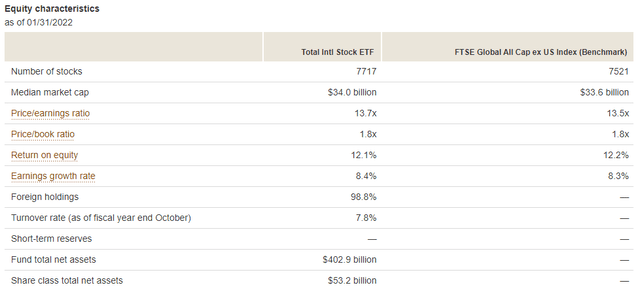
investor.vanguard.com VXUS
The above shows how well the ETF is mirroring the underlying Index. Notice the ETF owns almost 200 more stocks than the Index does.
investor.vanguard.com VXUS
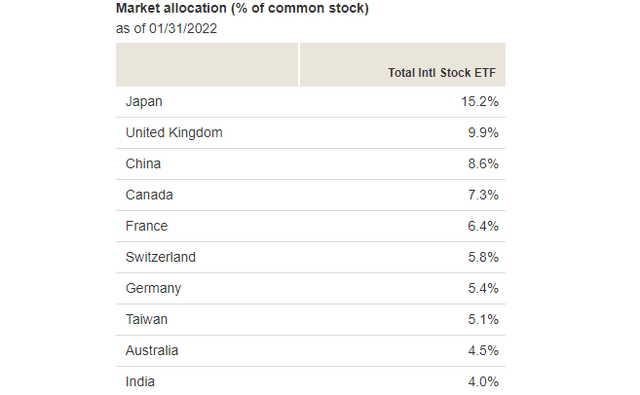
The Top 10 countries are 72% of the ETF. Developed Europe (40%) and Developed Asia (26%) are the top regions, with worldwide EM stocks placing third at 25.6%.

seekingalpha.com VXUS Holdings
Unlike the Vanguard Total Stock Market ETF (VTI), which covers the entire US equity market, Technology stocks comprise about half the weight in VXUS and place third, behind Financials and Industrials, two prominent sectors in EM countries. Because most energy assets in the included Middle East countries are not public companies (Saudi Aramco being a big exception), the Energy sector is a very small part in this ETF.
seekingalpha.com VXUS holdings
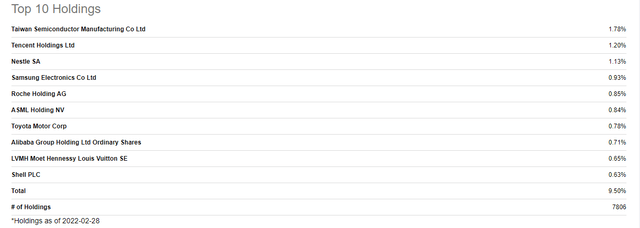
As one would expect for an ETF with almost 8000 stocks, no one stock dominates, nor does the Top 10 (9.5% of assets).
VXUS Distribution review

seekingalpha.com VXUS DVDs
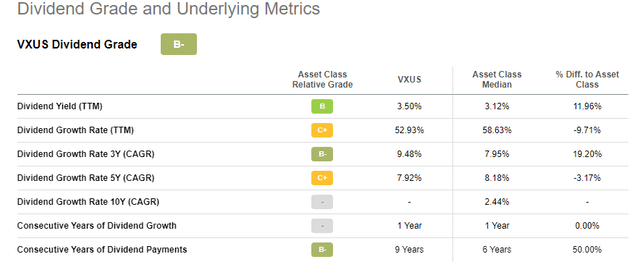
Except for the extra-large payout at the end of 2021, dividends have been steady over the years. As with many International ETFs, the June and December payouts are larger as a result of some international companies only paying dividends on a semi-annual basis. This is how Seeking Alpha grades VXUS’s dividend performance:
seekingalpha.com VXUS scorecard
Examining the iShares Core MSCI Total International Stock ETF
Seeking Alpha describes this ETF as:
The iShares Core MSCI Total International Stock ETF is an exchange traded fund launched by BlackRock, Inc. It is managed by BlackRock Fund Advisors. The fund invests in public equity markets of global ex-US region. The fund invests in stocks of companies operating across diversified sectors. It invests in growth and value stocks of companies across diversified market capitalization. The fund seeks to track the performance of the MSCI ACWI ex USA IMI. IXUS started in 2012.
Source: Seeking Alpha
IXUS has $29b in assets, making it about half the size as VXUS. Yield (3.4%) and fees (9bps) match up well with the other ETF.
Reviewing the MSCI Index used by IXUS
MSCI describes their Index as:
The MSCI ACWI ex USA Investable Market Index (IMI) captures large, mid and small cap representation across 22 of 23 Developed Markets countries (excluding the United States) and 25 Emerging Markets countries. With 6,703 constituents, the index covers approximately 99% of the global equity opportunity set outside the US.
Source: MSCI
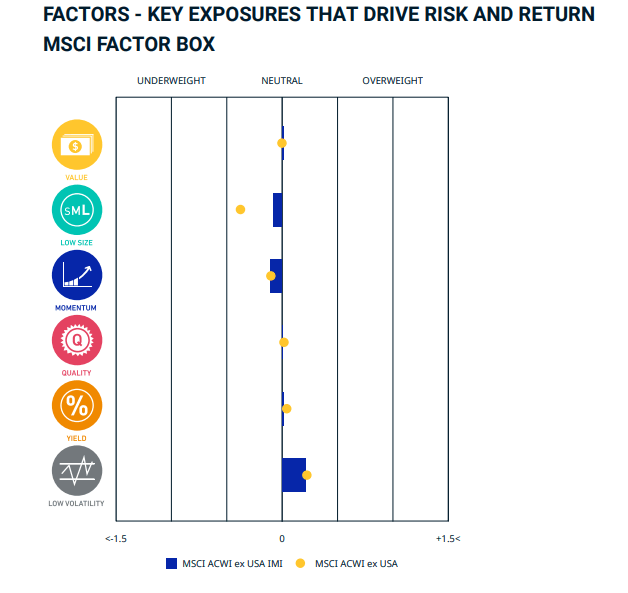
MSCI actually has a similar Index, the MSCI ACWI ex USA Index and the next chart compares the two on six factors.
msci.com
The iShares MSCI ACWI ex-U.S. ETF (ACWX) uses the second Index and its performance trails both of these ETFs.
I did not find the index-specific methodology document but one that explains the process for the full set of the MSCI Global Investable Market Indexes. Here are some key points from that document.
Constructing the MSCI Global Investable Market Indexes involves the following steps:
• Defining the Equity Universe for each Market. Very few limitations seem to apply.
• Determining the Market Investable Equity Universe for each Market. Requirements include size, liquidity, free-float, and foreign ownership limits.
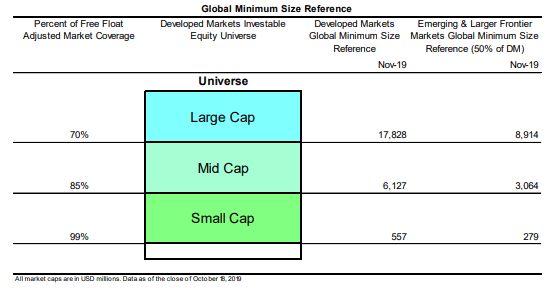
• Determining market capitalization size-segments for each Market. The next chart shows how that varies by country-classification.
MSCI methodology.pdf
• Applying Index Continuity Rules for the Standard Index. Like many indices, to reduce turnover, leniency is granted to current index components. Looser rules can be used to maintain country/sector exposure in the specialized indices.
• Classifying securities under the Global Industry Classification Standard (GICS®).
• Using a building block approach, Regional and Composite Indexes can be created from the individual Market Indexes for each size-segment. GICS-based, share type-based and other more granular indexes may also be derived from the Market, Regional and Composite Indexes.
IXUS Holdings review
iShares.com; compiled by Author
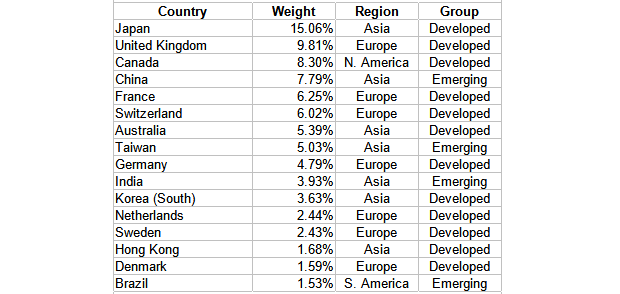
The above represents every country with greater than 1.5% exposure. Allocations align with VXUS as IXUS has 38% in Europe, 27% in Asia, and worldwide EM exposure of 23.5%. Like VXUS, the Top 10 countries, all of which matched, also equal 72% of the assets.

seekingalpha.com XUS Holdings
Sectors follow VXUS very closely and that will be examined more in detail when I compare the two ETFs.
seekingalpha.com IXUS Holdings
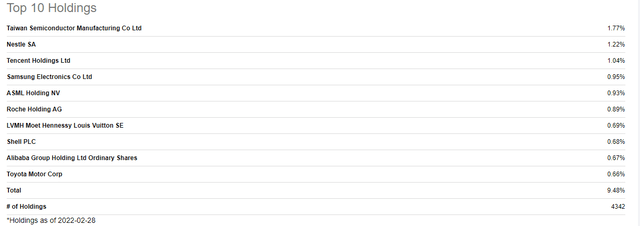
First thing to notice is IXUS holds 3500 fewer stocks than VXUS, yet the Top 10 concentrations are the same. The Top 10 stocks are all the same, though in a slightly different arrangement. The security count difference had little effect on the Top 10 market-cap allocation between the ETFs.
IXUS Distribution review

seekingalpha.com IXUS DVDs
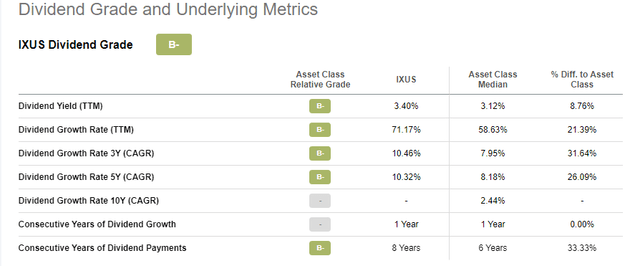
IXUS apparently dealt with holdings paying semi-annually by only paying out its income twice a year. Like VXUS, little growth is shown outside the extra-large payment at the end of 2021. Seeking Alpha gives IXUS the following dividend grades.
seekingalpha.com IXUS scorecard
Like VXUS, IXUS also received an overall grade of “B-“.
Side by Side review
First, let’s look at some ETF ratios. Note that the Vanguard data is a month older. While most are very close IXUS has better growth percents except for Book-Value growth. All the close ones favor IXUS. The next comparisons are sectors and countries.
personal.vanguard.com/us/funds/vanguard/compare
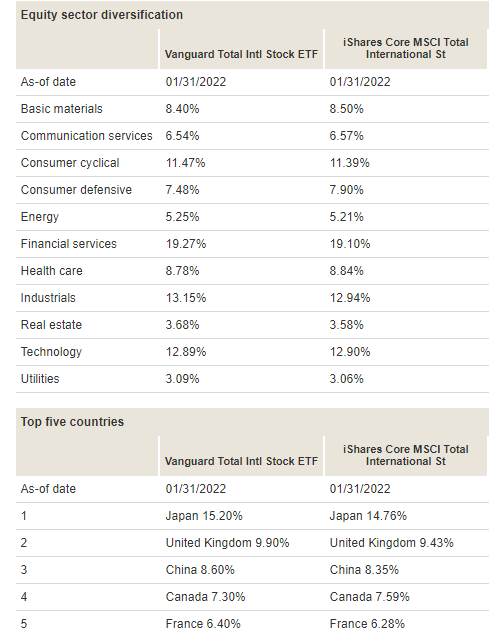
Sector wise, the only “large” weighting difference is in Consumer Defensive, where IXUS has .42% more than VXUS. Weighting differences are under .5% using the 1/31/22 data. The IXUS data varies some from above as the comparison site data is older.
Reviewing data from ETF Research Center shows an investor basically owns the smaller IXUS by investing in VXUS as 94% of IXUS’s lower number of stocks are held by VXUS. The two ETFS have an 87% overlap measured by weight. When looking at individual positions, the largest weight difference, in either direction is .3%.
What this has meant for investors
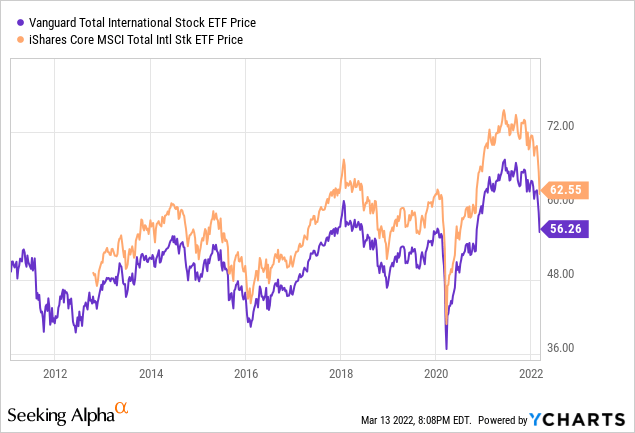
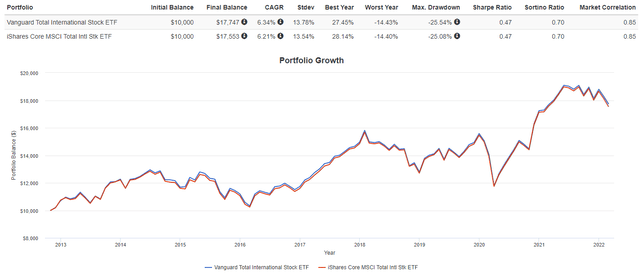
To convert the above into CAGR and Risk measures, I turned to Portfolio Visualizer for the following data.
portfoliovisualizer.com
Since IXUS started in late 2012, a $10,000 investment had VXUS $194 ahead, with barely noticeable 2nd place risk statistics to the point that the Sharpe and Sortino ratio matched. The shorter, 5-year CAGR has IXUS ahead by 1bps. The VXUS ETF consistently generated slightly more income each year.
Portfolio Strategy
Assuming an investor was looking to add or increase to their existing international equity exposure, unless they prefer iShares ETFs, my choice between these two would be the Vanguard Total International Stock ETF.
That said, there are factor-based International ETFs one should include in their due diligence. I mentioned my article that reviewed the WisdomTree International Hedged Quality Dividend Growth Fund (IHDG), for those who want to minimize the dollar’s movement against other currencies. I also recently compared two ETFs for invests preferring either Yield or CAGR: VYMI Vs. VEI. The key is knowing why you are adding international equity exposure to your portfolio.
Final Thought
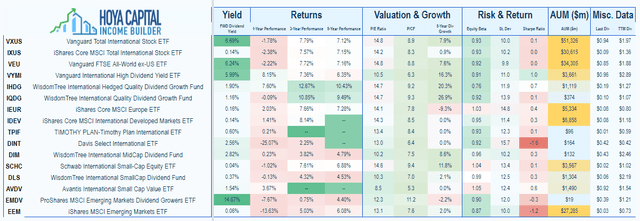
The next list provides a sample of how the international equity market can be invested. Any countries, especially China, have single-country ETFs.
Hoya Capital Income Builder
[ad_2]
Source links Google News

