[ad_1]

narvikk/E+ via Getty Images
VictoryShares Dividend Accelerator ETF (NASDAQ:VSDA) is a concentrated portfolio of carefully selected U.S. large- and mid-cap dividend-paying stocks that have specific quality characteristics pointing to their potential to continue increasing DPS going forward.
At first blush, this might be a solid strategy for long-term DGI-oriented investors seeking exposure to the U.S. market upper-echelon high-quality durable yields but without a too-heavy allocation to tech bellwethers. But even though I like sophisticated, attentively calibrated dividend strategies, I believe it does not make VSDA a Buy since it is a rather risky investment at these levels.
There are a few issues worthy of concern. First, VSDA is one of the most overvalued dividend ETFs amongst those I cover. Amid the lingering decline in growth premia across the board as the market adapts to higher financing costs and, hence, higher cost of equity, this is a precarious proposition. More details on that are below in the article.
Second, I believe its yield of just ~1.6% is fairly mediocre, and even considering a ~13.7% annual growth in distributions, which is consistent with a 3-year CAGR and, in theory, should be achieved given a reasonably calibrated strategy relying on financially resilient large-size companies, this might translate only into a ~2.9% yield-on-cost in May 2027. In a less optimistic scenario, with just a ~8.6% consistent growth (in-line with the TTM level), the YoC would reach just ~2.4%. Another way of saying, the fund is a pass for investors seeking a yield over capital appreciation. Third, I highlight lackluster AUM trends as worrisome.
The investment strategy and the portfolio
The Nasdaq Victory Dividend Accelerator Index lies at the crux of VSDA’s investment strategy. The index is reconstituted annually, in April, so the current version of the ETF’s portfolio is rather fresh; the rebalancing is due in July, then in October and January.
According to the methodology, the index managers use a multi-step process to select 75 stocks with characteristics supportive of future dividend growth.
The Nasdaq US Large Mid Cap Index, which excludes real estate investment trusts and business development companies, is a selection universe. As an inevitable consequence, VSDA holds no REITs, so investors seeking real estate-backed yields should understand that they get no exposure to them with this ETF.
Dividend durability is measured using a few parameters. First, a five-year DPS growth streak is a must. Second, 15 factors, from dividend yield and net income stability to trailing E/P and gross margin are amalgamated to pick top names. The full list of metrics is available on page 3.
Ultimately, the index constituents are weighted using a modified market cap; the algorithm is described in greater depth on page 4 of the methodology.
In the current version, the VSDA portfolio contains 75 stocks, with the top ten accounting for ~26.6%. Since the candidates for inclusion face a tough fundamentals/dividend sustainability test, it is no coincidence that close to 80% of the holdings have a Dividend Safety grade of at least B-, like Cisco Systems (CSCO), while ~93% have a robust Consistency grade, including Nordson (NDSN).
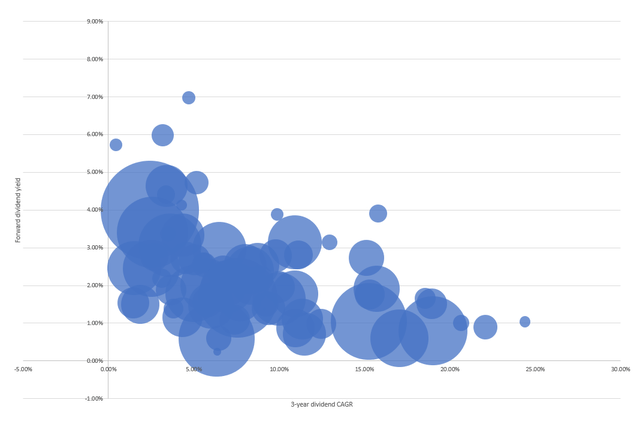
The scatter plot below summarizes weights, the forward yields, and 3-year DPS CAGRs of the holdings. As you can see, though there are a few outliers, most have sub-15% DPS CAGR and sub-3% yields.

Created by the author using data from Seeking Alpha and the fund
Reasons for skepticism
The major downside of this seemingly winning strategy is valuation. As I have outlined in a few articles this month, in the current market environment, the value factor is perhaps the central one, given how ruthlessly stocks with excessive growth premia have been selling off this year. I have also emphasized that quality combined with value is probably the safest factor mix at the moment.
VSDA has quality, no doubt. It is no surprise for an ETF that selects its investments in a meticulous manner, paying due attention to numerous factors from returns on invested capital to balance sheet and sales stability.
To corroborate, around 94% of its net assets are allocated to stocks with a Quant Profitability grade of B- or better. Just two have D+ grades, namely Stanley Black & Decker (SWK), an S&P 500 dividend aristocrat, and Sonoco Products (SON), an S&P 400 dividend aristocrat. However, it should be noted that in the case of SWK, the only issue is negative net operating and free cash flows, while other metrics are either on par with the sector medians or even higher, like its gross margin; SON, nevertheless, has a different story, with margins mostly well-below the materials sector medians. Anyway, VSDA is grossly overweight in stocks with resilient margins and solid returns on capital. But what about valuation?
Here comes the major problem. That is not an easy task to find a stock that is trading at a discount to the sector inside the VSDA portfolio. Just ~7.6% have a Valuation grade of at least B-, while around 65% are clearly overappreciated, with a rating of D+ or lower, including Apple (AAPL), Brown-Forman (BF.B), and Mastercard (MA), to name a few.
Next, the fund is overweight in industrials (~28.2%), a sector traditionally deemed as rich with value opportunities given high capital intensity welcomes lower multiples. But it would not be an exaggeration to say that VSDA selected the most expensive industrial stocks possible, or those with Quant Valuation grades of D+ or worse.
Just three amongst 17 industrial companies in the basket, like 3M (MMM), the above-mentioned SWK, and Emerson Electric (EMR) are valued on par with the sector. The table below provides a better context.

Created by the author using data from Seeking Alpha, VSDA, and IWV. Holdings as of May 11. Quant data as of May 14.
For even better context, the fund’s second-largest sector, consumer staples (~19.4%) has the exact same issue as most players are valued at a premium except for Altria (MO), Walgreens Boots Alliance (WBA), and Archer-Daniels-Midland Company (ADM).

Created by the author using data from Seeking Alpha, VSDA, and IWV. Holdings as of May 11
Finally, the IT sector (~11.8%). Little differences can be observed, impeccable quality together with lofty valuation.

Created by the author using data from Seeking Alpha, VSDA, and IWV. Holdings as of May 11
Final thoughts
In sum, VSDA’s dividend-growth strategy is supportive of solid profitability characteristics, but its valuation is far from optimal.
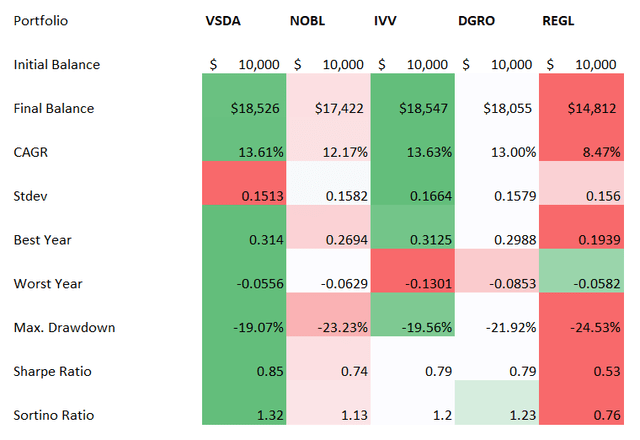
What about returns? From April 2017 (VSDA was incepted on 18 April 2017) to May 2022, VSDA delivered a total return in-line with the iShares Core S&P 500 ETF (IVV), outperforming its peers that focus on consistent dividend growth including the ProShares S&P 500 Dividend Aristocrats (NOBL), ProShares S&P Midcap 400 Dividend Aristocrats ETF (REGL), and iShares Core Dividend Growth ETF (DGRO).
More likely, the culprit was its higher expense ratio compared to IVV, 35 bps vs. 3 bps. Also, it should not go unnoticed that the ETF achieved the highest Sharpe and Sortino ratios in the group, which means investors were rewarded with higher returns for taking more risks.

Created by the author using data from Portfolio Visualizer
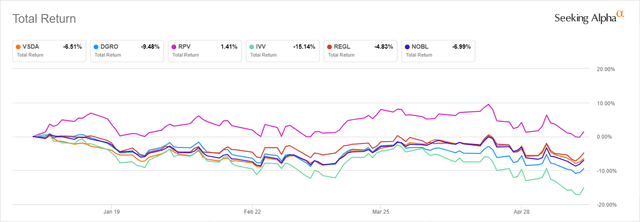
This year, it has outperformed IVV though failed to keep pace with REGL and the Invesco S&P 500 Pure Value ETF (RPV); I believe the expensiveness of its holdings is to blame.

Seeking Alpha
To conclude, given elevated uncertainty as the market faces a few interest rate hikes coupled with a stagflation risk in case fighting inflation results in borrowing costs climbing too high and too fast, hence, suppressing economic growth, exposure to premium multiples is exceedingly risky now. That being said, with a rather mediocre dividend yield and even assuming consistent growth in distributions in the medium term, this smart beta ETF is a Hold at best.
[ad_2]
Source links Google News

