[ad_1]

Olivier Le Moal/iStock via Getty Images
Investment Thesis
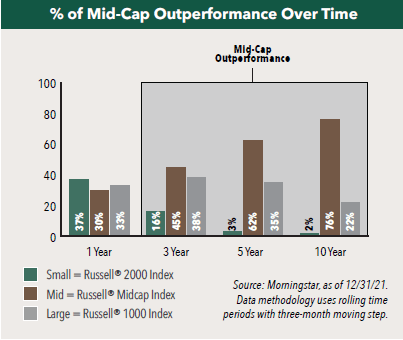
Over the years there has been significant research around the small-firm effect, which states there are two classifications of stocks (large and small) and that the companies with small-market capitalizations have higher returns. Institutional and retail investors created the “mid-cap” category in the early 1990s and, since then, the risk-adjusted returns have been exceptional, relative to small- and large-cap stocks. According to Hennessy Funds, in any given 1-year rolling period since 2000, small-, mid-, and large-cap stocks have outperformed 37%, 30%, and 33% of the time. However, the longer mid-cap stocks are held, the more often they outperformed. In fact, 76% of the time, mid-caps outperformed small- and large-cap stocks over any 10-year rolling period in the past 20 years. Not only have mid-cap stocks generated higher absolute returns over a longer time frame, but they have also provided these returns with less associated risk. Over the 20-year period ended 12/31/21, investors in mid-caps have experienced higher returns and lower risk relative to investors in small-caps. In addition, while mid-caps had more risk than large-caps, investors have been rewarded with a higher return over the same period. In this article, I will review the Vanguard Mid Cap ETF (NYSEARCA:VO), which provides exposure to a diversified basket of US mid-cap stocks.

Hennessy Funds
Strategy Details
The Vanguard Mid-Cap ETF tracks the performance of the CRSP US Mid Cap Index, which measures the investment return of a broadly diversified index of mid-size U.S. stocks. VO attempts to replicate the target index by investing all, or substantially all, of its assets in the stocks that make up the index, holding each stock in approximately the same proportion as its weighting in the index.
If you want to learn more about the strategy, please click here.
Portfolio Composition
VO places a high weight on the technology sector (representing around 22.90% of the index), followed by industrials (accounting for 12% of the index) and health care (representing around 12% of the fund). The largest three sectors have a combined allocation of approximately 47.30%. I like the fact that VO is well diversified across sectors. In terms of geographical allocation, VO invests more than 98% of the funds in the US.

Seeking Alpha
VO invests ~35% of the funds into mid-cap blend stocks, characterized as companies where neither value nor growth characteristics predominate. Mid-cap issuers are usually defined as companies with a market capitalization between $2 billion and $8 billion. The second-largest allocation is in mid-cap growth equities. Unsurprisingly, VO allocates more than 82% of the funds to mid-caps, which is part of the strategy.

Morningstar
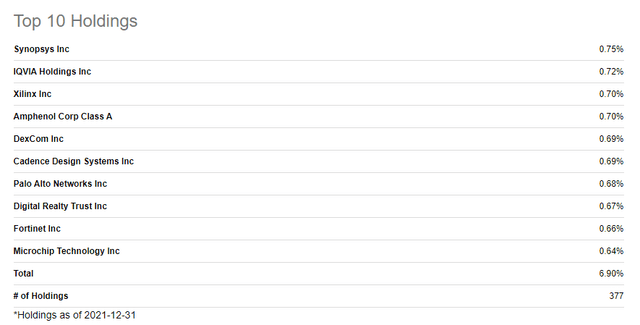
The fund is currently invested in 377 different stocks. The top ten holdings account for 6.9% of the portfolio, with no single stock weighting more than 1%. All in all, VO offers a very good level of diversification.

Seeking Alpha
Since we are dealing with equities, one important characteristic is the valuation of the portfolio. According to data from Morningstar, the fund currently trades at a price-to-book ratio of 3.09 and an average price-to-earnings ratio of 21.2. In my opinion, VO is expensive at the moment, especially when you factor in the fact that the Fed is preparing to tighten its monetary policy and raise interest rates, which has a negative impact on long-duration assets such as stocks.
Is This ETF Right for Me?
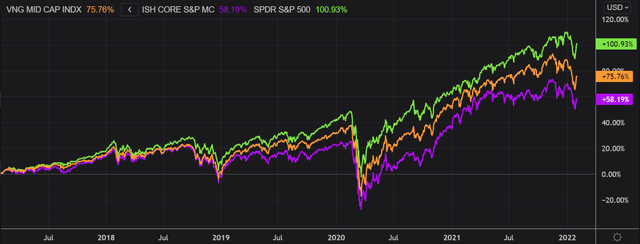
The fund has a distribution rate of 1.19%. Given the low dividend yield, this ETF is not suitable for the dividend investor. I have compared below the price performance of VO against the price performance of the SPDR S&P 500 Trust ETF (NYSEARCA:SPY) and the iShares Core S&P MidCap ETF (NYSEARCA:IJH) over 5 years to assess which one was a better investment. Over that period, SPY outperformed VO by a ~25 percentage points margin. That said, VO did better than IJH and outperformed it by 18 percentage points. To put VO’s performance into perspective, a $100 investment in this ETF 5 years ago would now be worth $175.76 representing a compound annual growth rate of ~12%, which is a good absolute return.

Refinitiv Eikon
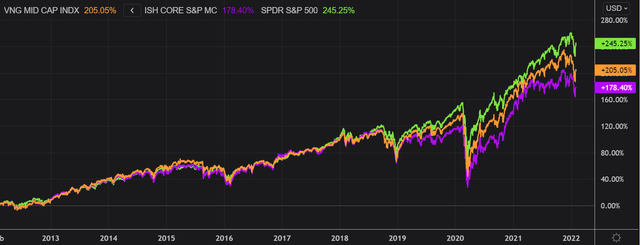
If we take a step back and look at the performance of the strategy from a 10-year perspective, the results don’t change much. SPY outperformed both mid-cap strategies. It is worth noting that both mid-cap strategies were performing similarly to SPY until the March 2020 crash. After that pullback, the performance spread between the two ETFs widened. I think it just shows how a few large-caps really pulled the market upward after 2020 and delivered an outstanding performance.

Refinitiv Eikon
Key Takeaways
VO provides exposure to a diversified basket of US mid-cap stocks. This ETF is very well diversified, both across sectors and issuers, and can be used as part of a broader portfolio strategy to get exposure to midcap stocks. The bullish thesis for midcap stocks is that they have generally delivered higher risk-adjusted returns than small caps and large caps over long periods of time. VO provided good absolute returns in the past and I expect this trend to continue going forward. However, VO is not cheap at the moment, and I would personally prefer to wait for a 15-20% pullback before buying this ETF.
[ad_2]
Source links Google News

