[ad_1]
The Vanguard Consumer Staples Index ETF (NYSEARCA:VDC) offers investors exposure to one of the core market sectors in a low-cost diversified exchange traded fund. Consumer staples refers to goods that are considered essential, or at least play a more important role in the day-to-day lives of consumers. The thought is that these firms are less exposed to the economic cycle, as consumers in a recession would likely first cut “discretionary” spending before giving up purchases on food and beverages, household and personal items, along with alcohol and tobacco. Staples as a group are seen as a less volatile part of the market with lower average risk. This “defensive” aspect of the underlying stocks has been one of the main themes this year driving a strong performance among the sector leaders. On the other hand, the current market volatility and renewed concerns over global cyclical conditions raise valuation concerns as many companies in the sector have been bid up to historically expensive levels. We are bearish on VDC, not necessarily picking on the fund, but more based on our market expectations for the sector. This article highlights the performance and valuation of underlying VDC stocks and provides an outlook for the consumer staples.
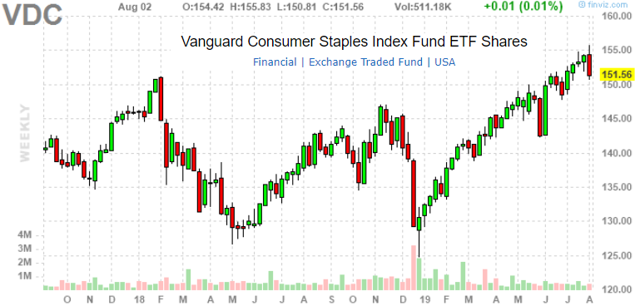
VDC stock price chart. Source: FinViz.com
VDC vs. XLP Background
With an inception date in January 2004 and current total assets under management of $5.9 billion, it is the second largest “consumer staples” sector-specific ETF against the more popular Consumer Staples Select Sector SPDR ETF (NYSE:XLP) with $12.4 billion in AUM. Data shows that the Vanguard fund has a mixed record against XLP with each alternating between years of under- and over-performance. VDC has outperformed XLP since its inception, but more recently has underperformed. Year to date 2019, VDC is up 16.95% against 18.17% in XLP on a total return basis. Over a five-year period, VDC has returned 53.57% against 55.69%.

VDC vs. XLP performance data. Source: data by YCharts/table author
The reason for VDC’s slight underperformance is likely related to its portfolio construction and broader exposure to the sector against XLP only tracking S&P 500 constituents. The market over the past year has been led by large- and mega-cap stocks, while small caps have trailed. VDC is a more diversified fund with 93 holdings vs. the more concentrated 34 stocks in XLP, and thus has more exposure to smaller companies.
| Vanguard Consumer Staples | SPDR Consumer Staples | |
| Inception Data | 01/2004 | 12/1998 |
| Total Assets | $5.9B | 12.37B |
| Expense Ratio | 0.10% | 0.13% |
| # of Holdings | 93 | 34 |
| Weight of Top 10 Holdings | 64.4% | 70.8% |
| Dividend Yield TTM | 2.4% | 2.7% |
VDC vs XLP key stats. Source: data by YCharts/table author
Of note, VDC has a 3 basis point cost advantage with an expense ratio at 0.10% compared to 0.13%, but hardly a defining reason to favor one over other. VDC is less “top heavy” with the top 10 holdings representing 64.4% weighting in the fund versus 70.8% in XLP. XLP’s dividend yield is currently higher at 2.7%. The choice investors make between VDC and XLP really comes down to a preference for have a wider exposure to the broader sector in VDC, or a higher concentration in the “leaders” with XLP. In a market environment where small caps outperform, VDC may have a slight advantage.
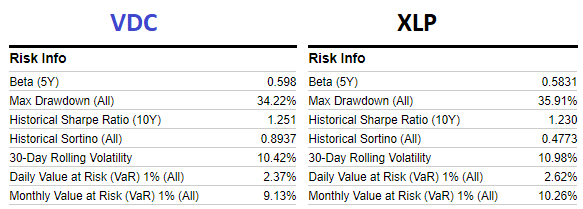
VDC vs. XLP Risk Metrics. Source: Risk Metrics
In terms of risk metrics, we point out that VDC and XLP share a similar profile with measures like beta, drawdown, 30-day volatility, and historical value at risk only fractionally different. An argument can be made that VDC does have materially better “risk adjusted returns” with a Sharpe ratio at 1.25 vs. 1.23 in XLP. The Sortino Ratio, which controls for only downside volatility, shows that VDC is stronger at 0.89 vs. 0.48 in XLP. Again, the differences here come down to the wider diversification in VDC. It’s important to note that many of these metrics have been supported by the current historic bull market over the past 10 years. By this measure, implied risk and volatility measures are low, but it could be different going forward. The next 10 years may not mirror historical returns.
While VDC outperformed XLP historically since inception and over the past decade, trends in the market favoring the mega-cap leaders have resulted in stronger returns for XLP more recently. Overall there isn’t anything to conclusively say one fund is “better” than the other, but a closer look at the holdings offers some clues in what will be the important trends going forward.
VDC Performance
As mentioned, VDC is up 17% in 2019. Despite the current volatility in the market given the renewed U.S.-China trade tensions and uncertainty regarding the direction of Fed monetary policy, it’s been a strong year for stocks. Better-than-expected corporate earnings coupled with resilient economic growth has led strong gains in the sector particularly in the context of depressed levels the market ended 2018 with extreme volatility observed in December of last year. We think the year ahead will be different. As it relates to consumer staples, we believe we are at an inflection point in the market signaled by the recent Fed rate cut and escalation of the trade dispute. Looking 6 to 12 months down the line, it’s possible we look back at this time as a great opportunity to reduce risk exposure as some of these gains may be rolled back.
The table below shows performance data for the top 25 holdings. Most stocks here are trading within a few points of their 52-week high and are in effective bull markets. We think there is enough reason to be at least cautious at current levels.
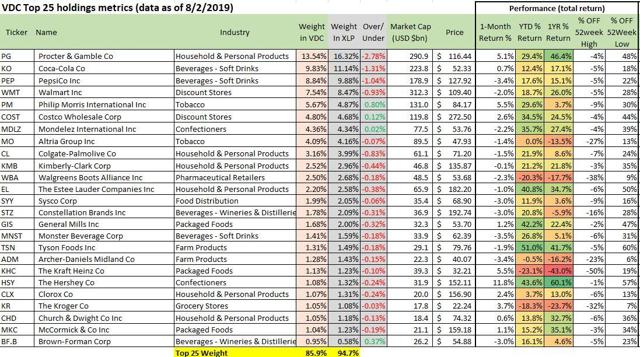
VDC top holdings performance data. Source: Data by YCharts/ table author
Among the top holdings, Tyson Foods (NYSE:TSN), The Hershey Co. (NYSE:HSY), General Mills (NYSE:GIS), and The Este Lauder Companies Inc (NYSE:EL) are the biggest winners up 51%, 43.6%, 42.2%, and 40.8% each respectively. VDC is underweight 21 of the top 25 holdings relative to XLP. The largest holding in the fund is Procter & Gamble Co. (NYSE:PG), up 46.4% over the past year, and VDC has a lower exposure at 13.54% compared to 16.32% in XLP. The data above demonstrates why and how VDC has trailed XLP in 2019.
Valuation
One of the concerning trends here is what we believe to be aggressive growth premiums assigned to the leaders in the sector. Among the top 10 holdings like PG, Coca-Cola Company (NYSE:KO), PepsiCo (NYSE:PEP), Walmart Inc. (NYSE:WMT), and Colgate-Palmolive Co, (NYSE:CL), the average forward P/E ratio for these particular stocks is 23.9x. These five stocks together represent 43% of the fund’s holdings and by most objective measures including an average price-to-sales ratio of 3.7x are expensive. On the other hand, data for year-over year revenue growth reported by these companies in the last quarter was up just an average 2.5%. The disconnect we see here is that many of these consumer staples stocks which have historically been associated with a “value” style are trading more like “growth” stocks, but aren’t convincing as either.
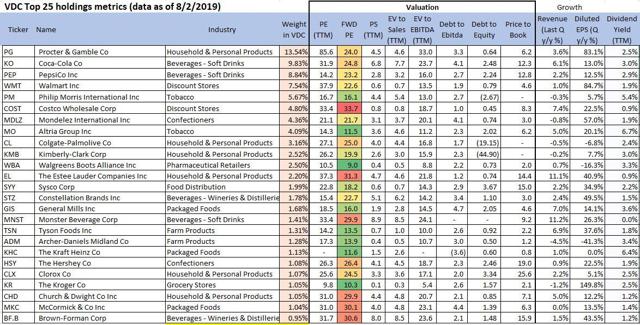
VDC top holdings valuation metrics. Source: data by YCharts/table author
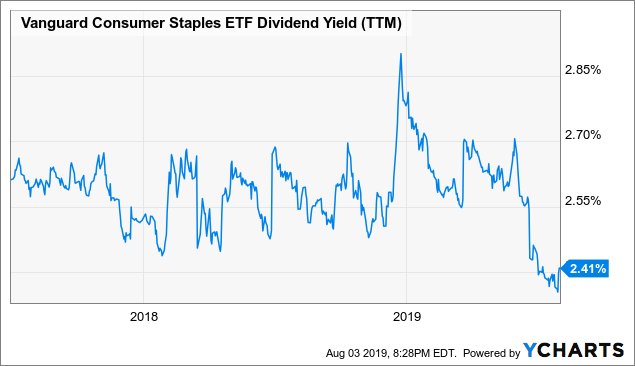
From a bottom-up analysis on the sector, we view the large multiples as representing higher risk and increased volatility going forward should any number of things go wrong. Beyond the clear catalyst for significant downside which is the emergence of a global cyclical slowdown and recession in the United States, the stocks now have more downside risk as they would each need to fall further to “normalize” to average multiples from the past decade. PG for example has a 10-year P/E ratio average of 19.8x; if conditions deteriorate, the stock would have to fall 18% just to reach its historical average. This dynamic could play out across the entire market, but consumer staples are particularly exposed given investors have bid up these shares in an apparent “flight to safety” with the perceived quality of their dividends. Indeed, the dividend yield for VDC currently at 2.4% is at the lowest level in at least two years, which reinforces our view that the sector is expensive.
 Data by YCharts
Forward-Looking Commentary
We have good news and bad news for VDC investors. The bad news is that we are bearish on VDC with a negative market outlook for consumer staples given our valuation concerns among sector leaders. Investors should demand a higher yield for the implied risks, and this could materialize as shares sell off in a rotation towards bonds as rates fall. The good news is that we see VDC outperforming XLP over the next year as the mega-cap stocks in the sector likely face the greatest risk of “resetting” and the diversification in VDC will help with lower volatility. Essentially, we favor VDC over XLP in the near term, but still bearish on the sector.
Disclosure: I/we have no positions in any stocks mentioned, and no plans to initiate any positions within the next 72 hours. I wrote this article myself, and it expresses my own opinions. I am not receiving compensation for it (other than from Seeking Alpha). I have no business relationship with any company whose stock is mentioned in this article.
Additional disclosure: The information contained herein is for informational purposes only. Nothing in this article should be taken as a solicitation to purchase or sell securities. Investing includes risks, including loss of principal.
[ad_2]
Source link Google News

