[ad_1]

marchmeena29/iStock via Getty Images
Investment Thesis
The Vanguard S&P 500 Value ETF (VOOV) was the first ETF I ever reviewed on Seeking Alpha in September 2020, and on reflection, it was a nice way to start building up my audience that included just 17 followers at the time. VOOV has many of the features strong ETFs should have, including low fees and good diversification levels, and I recommended S&P 500 investors switch to it as a way to take profits while still maintaining market exposure. It ended Q4 2020 by beating the Vanguard S&P 500 ETF (VOO) by 2% and still holds about a 6% edge through January 26, 2022. A little less volatility and a little more in dividends didn’t hurt, either.
While I still believe value investing will outperform going forward, the purpose of the article today is to caution investors about continuing to use VOOV as their value vehicle. I have compared its fundamentals with VOO, and I don’t see it having the same advantages as before. The ETF has many of the same earnings risks as the mega-caps in VOO. Its valuation is only slightly cheaper. And, it runs the risk of underperforming should S&P 500 stocks soundly beat analysts’ expectations this quarter.
As an ETF analyst on Seeking Alpha, one advantage I have is knowing the wide variety of choices investors have. That is why I will be providing you with five other large-cap value ETFs that offer different combinations of growth and value so that you can make the best decision for your portfolio. I look forward to taking you through the Vanguard S&P 500 Value ETF and these other options, and I hope to continue the conversation in the comments section afterward. With that said, let’s begin with an overview of VOOV.
VOOV Overview
Strategy & Fund Basics
VOOV passively tracks the S&P 500 Value Index, which measures value using three factors: the ratios of book value, earnings, and sales to price. The resulting portfolio not only reweights stocks based on these factors but excludes some of the biggest names, including seven of the S&P 500’s top ten holdings. S&P Style Indices are rebalanced annually on the third Friday in December, so we have a relatively fresh set of holdings to analyze today.
Before we look at VOOV’s composition, I’ve summarized some of its key facts below for easy reference:
- Current Price: $145.23
- Assets Under Management: $2.49 billion
- Expense Ratio: 0.10%
- Launch Date: September 7, 2010
- Trailing Dividend Yield: 1.94%
- Five-Year Dividend CAGR: 5.31%
- Five-Year Beta: 1.02
- Number of Securities: 448
- Portfolio Turnover: 18.40%
- Assets in Top Ten: 16.49%
- 30-Day Median Bid-Ask Spread: 0.04%
- Tracked Index: S&P 500 Value Index
Sector Exposures & Top Ten Holdings
Using the Morningstar Fund Compare Tool, we can quickly see how VOOV compares with VOO and the Vanguard S&P 500 Growth ETF (VOOG) by their exposures to the 11 GICS sectors. It adds about 11% to defensive stocks with offsets primarily in economically sensitive ones compared with VOO. In particular, it underweights Technology stocks by 17% and overweights both Financials and Consumer Defensive stocks by about 5% each.
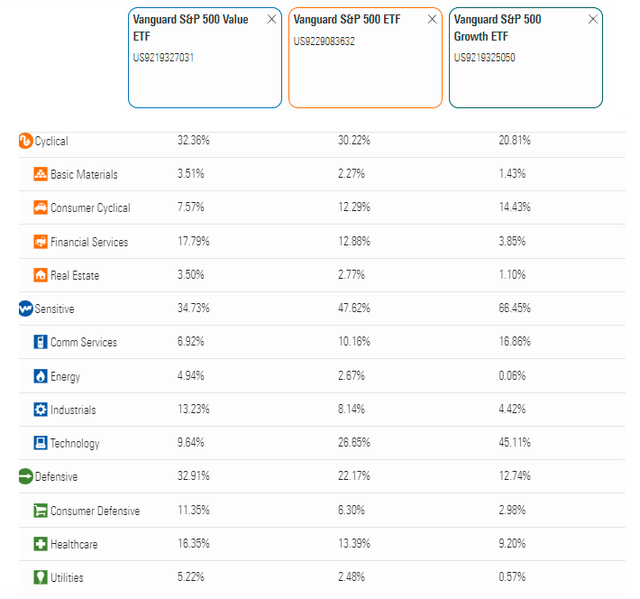
Morningstar Fund Compare Tool
The key drivers, as mentioned earlier, are the absence of mega-cap growth stocks and a fundamentally-based weighting scheme rather than VOO’s market-cap-weighted method. VOOV excludes about 50 stocks held in VOO, most notably Apple (AAPL), Microsoft (MSFT), Alphabet (GOOGL, GOOG), Amazon (AMZN), Tesla (TSLA), Meta Platforms (FB), and NVIDIA (NVDA). It’s a significant departure since these seven stocks account for 25.39% of the S&P 500. Instead, Warren Buffett’s Berkshire Hathaway (BRK.B) is the top holding, followed by Johnson & Johnson (JNJ) and Procter & Gamble (PG). Some oil majors are also in the top ten, like Exxon Mobil (XOM) and Chevron (CVX).
Vanguard
Historical Performance
Most are aware that the value strategy hasn’t performed as well as the growth strategy in the last decade. Although sentiment has recently changed, long-term investors in VOOV still found themselves trailing market returns, and the lesser volatility that often is a selling point hasn’t materialized. The graph below highlights how VOOV, VOO, and VOOG have performed since October 2010.
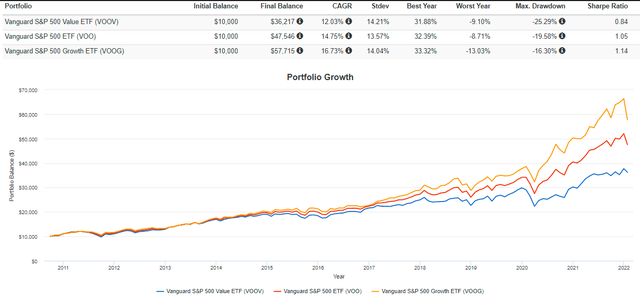
Portfolio Visualizer
This graph nicely shows the difference between a value, blended, and growth strategy and how the returns gap between them has widened since the pandemic began in Q1 2020. However, since December 2021, VOOV has gained 2.82%, while VOO and VOOG produced losses of 4.55% and 10.92%, respectively. I want readers to consider taking these profits off the table. What once was a substantial difference in valuation is relatively minor today. Allow me to describe this further with a detailed fundamental analysis comparison between VOOV and VOO.
Fundamental Analysis
VOOV vs. VOO Snapshot By Industry
An analysis of an ETF’s top holdings is helpful, but I’ve found that analyzing the top industries is better because often, assets within the same industry are highly correlated. In the case of VOOV, its top 20 holdings account for just 26.59% of its total exposure, but that number grows to 53.78% for the top 20 industries. Simply put, examining the top holdings narrows the focus too much, while looking at the sector exposures is too broad. Industry analysis is an excellent middle ground where we can easily see the factors that drive future returns. Consider the snapshot below.
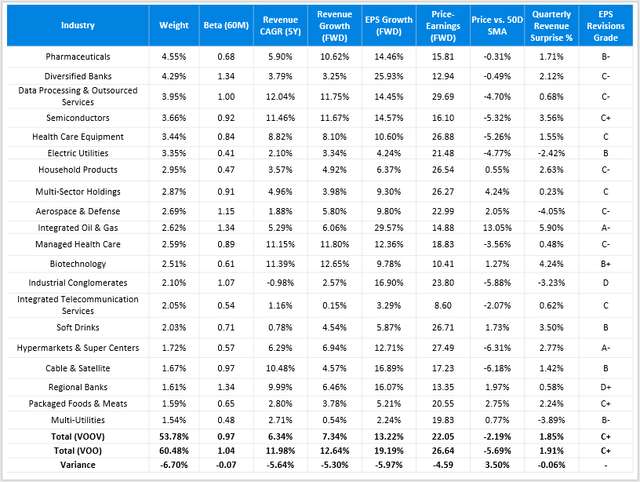
Created By Author Using Data From Seeking Alpha
You may find it surprising that VOOV doesn’t have a considerable advantage over VOO regarding concentration risk. The top 20 industries still account for 53.78% of the ETF, just 6.70% less than in VOO. Its holdings are also only slightly less risky based on the weighted-average five-year beta figure of 0.97. A key reason is the absence of volatile Technology Hardware and Interactive Media & Services stocks like Apple and Alphabet.
The most significant differences are with historical and estimated revenue and earnings growth rates and their relative valuations. On the revenue side, VOOV’s constituents have grown at a weighted-average annualized rate of 6.34% in the last five years compared to 11.98% for VOO. Analysts are also expecting these five-year trends to continue into 2022. The gap is similar on the earnings side, with strength in Diversified Bank stocks like JPMorgan Chase (JPM) and Wells Fargo (WFC) contributing to a 13.22% forward EPS growth rate. While impressive, it’s well below VOO’s estimated EPS growth rate of 19.19%. Again, the reason is the exclusion of VOO’s top holdings. Here’s a look at how well analysts expect these key companies will perform over the next 12 months.
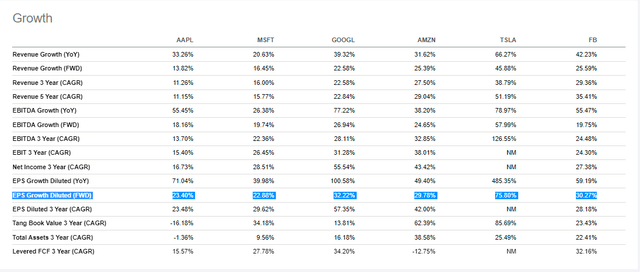
Seeking Alpha
Each company has an EPS growth rate of 20% or more. You could argue that these growth rates aren’t realistic, but they align with their three-year EPS growth rates. My general sense is that while some are probably still overvalued even with their recent setbacks, it would be an error to assume the majority are. At minimum, a blended portfolio including both ETFs seems prudent.
On the topic of valuation, notice the discount on forward earnings that VOOV currently offers (22.05x vs. 26.64x). In my view, and after calculating these figures for hundreds of U.S. equity ETFs in my database, I can confidently say there are several better deals for those looking for specific growth/valuation combinations. For example, the iShares Core High Dividend ETF (NYSEARCA:HDV) has outperformed VOOV by more than 4% since I published my analysis one month ago. At the time, its valuation was just 17x earnings.
I think it makes sense that if you’re going to give up a substantial amount of growth, you should try to get as much of a discount, especially if the value stocks aren’t surprising to the upside by much. From the table, both VOOV and VOO have near-identical last quarterly revenue surprise figures and an identical EPS Revisions Grade of C+. This suggests analysts are revising their estimates downward for both ETFs in a similar fashion. VOOV doesn’t have an advantage as we head into a crucial earnings season.
Earnings Season Update
According to the Yardeni Research Earnings Surprise Monitor, 100 S&P 500 companies have reported thus far and only surprised to the upside on earnings by 3.00%. It’s substantially lower than the previous few quarters and below the long-term trend of between 5% and 6%. Sentiment has quickly changed, and market participants have responded by punishing the most richly-valued stocks commonly found in growth ETFs like the Invesco QQQ ETF (QQQ). I suggested waiting for earnings season to be over before taking a position in QQQ in this article.
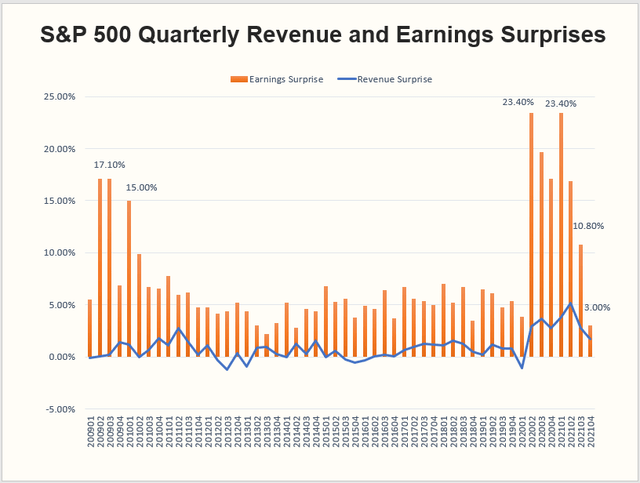
Created By Author Using Data From Yardeni Research
Though we’re still early into this earnings season, I’ve noticed that value stocks aren’t yet standing out. I’ve summarized 20 of the most notable ones in the table below, and it’s not hard to find examples that support both a value and growth thesis. On the one hand, stocks that VOOV is overweight on, like JPMorgan Chase and Wells Fargo, beat on earnings last quarter, but the bad news is their profitability levels remain weak. Microsoft continues to stand out on the growth side after reporting a 6.90% EPS surprise, and most analysts revised future EPS estimates upward.
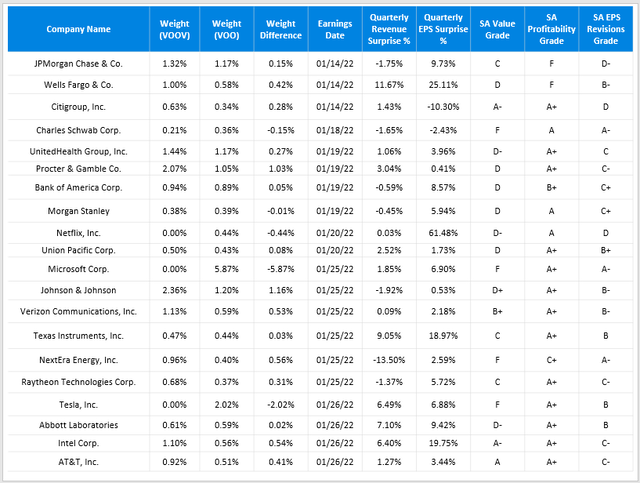
Created By Author Using Data From Seeking Alpha
Other Value ETFs To Consider
Earlier, I stated that other large-cap value ETFs are available that arguably have better fundamentals than VOOV. I’ve done some calculations on five ETFs that may be of interest to readers:
- Invesco S&P 500 Enhanced Value ETF (SPVU)
- iShares Russell Top 200 Value ETF (IWX)
- iShares Edge MSCI USA Value Factor ETF (VLUE)
- iShares Morningstar Value ETF (ILCV)
- Invesco S&P 500 Pure Value ETF (RPV)
The table below summarizes many of the metrics I’ve discussed in this article. As shown, all five have forward price-earnings ratios below VOOV’s, and all except RPV have better forward EPS growth rates, too. Investors have other considerations such as volatility, concentration, expenses, and sector exposures, but I hope this will get you started. I look forward to reviewing several of these next month.
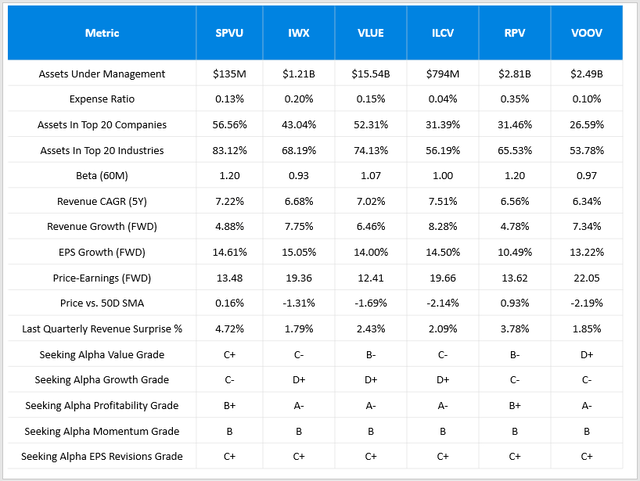
Created By Author Using Data From Seeking Alpha
Investment Recommendation And Conclusion
Value investors should reduce their allocation to VOOV and consider adding more S&P 500 Index exposure or looking for better deals elsewhere in the large-cap value space. In my view, paying 22x forward earnings is unnecessary for an ETF that’s unlikely to protect much more on the downside and has 6% less EPS growth than the S&P 500. Given the alternatives, investors can get higher growth at a lower price. In particular, SPVU looks attractive with its 13.48x forward earnings valuation and 14.61% forward EPS growth rate. In short, there are better choices available now, and I am happy to provide more to interested readers in the comments section below.
[ad_2]
Source links Google News

