[ad_1]
Nikada/iStock Unreleased via Getty Images
Investment Thesis
Growth investors looking for a bottom in the latest market selloff have probably considered the Vanguard Mega Cap Growth ETF (NYSEARCA:MGK). On the surface, there’s lots to like. Its 0.07% expense ratio is among the cheapest in the large-cap growth category, it’s concentrated in only the biggest and most profitable names, and it’s been the fourth-best-performing ETF in its class over the last decade. If you believe the correction is over, why not buy MGK?
In a word, valuation. Even today, MGK trades at 34x forward earnings, which is eight points more than the S&P 500. Compared to other popular growth ETFs like the iShares Russell Top 200 Growth ETF (IWY) and the iShares S&P 500 Growth ETF (IVW), MGK’s forward P/E is still two to three points higher. In my view, growth investors should hope for the best but plan for the worst. In this case, the worst would be if the trend favoring value stocks doesn’t reverse, and you’re left watching the valuations of stocks like Amazon (AMZN) and Tesla (TSLA) decline fast. Do yourself a favor and avoid MGK for now. There are cheaper options available, and I hope my list of alternatives will help you find the right one that meets your needs.
MGK Overview
Strategy & Fund Basics
Many Vanguard ETFs track CRSP Indexes that use dynamic breakpoints to determine how securities are classified. The mega-cap universe is defined as securities inside the top 70% of total market capitalization. Some flexibility is allowed to avoid unnecessary trading costs, so the Index won’t drop current constituents unless they fall outside the top 76%. In my view, it’s an efficient way to do things since these securities likely have weightings so low that their impact on the overall strategy is negligible.
CRSP constructs factor-weight growth and value versions for its mega-, large-, mid-, and small-cap size Indexes. The factors used to score growth stocks are listed below:

CRSP Indexes
It’s nice to see a variety of growth factors, both short- and long-term, used, as events like the pandemic can distort year-over-year values. However, one potential downside is that it may be slow to pick up on decelerating growth. For example, Zoom Video Communications (ZM) grew EPS by 99.61% over the last twelve months, but analysts expect growth to slow to 6.81% in the next year. Fortunately, these decelerations are mostly seen among stocks with negligible weightings, but it’s something worth watching. Right now, only three stocks in MGK’s top ten have a sub-20% forward EPS growth rate. They are Meta Platforms (FB), Visa (V), and Home Depot (HD), totaling just 7%.
I’ve listed some additional metrics below that you may find helpful for easy reference later.
- Current Price: $228.34
- Assets Under Management: $11.82 billion
- Expense Ratio: 0.07%
- Launch Date: December 17, 2007
- Trailing Dividend Yield: 0.48%
- Five-Year Beta: 1.02
- Number of Securities: 100
- Portfolio Turnover: 8.00%
- Assets in Top Ten: 61.40%
- 30-Day Median Bid-Ask Spread: 0.02%
- Tracked Index: CRSP US Mega Cap Growth Index
Sector Exposures and Top Ten Holdings
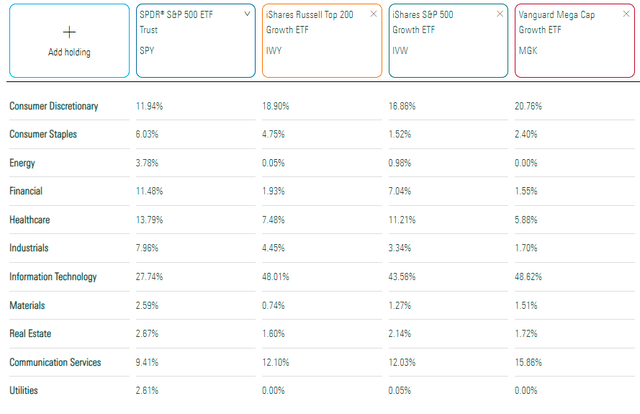
MGK, like most growth ETFs, is overweight technology stocks, which account for nearly half of its total. It also has more exposure to Consumer Discretionary and Communication Services stocks, with very little exposure in the other eight GICS sectors.
Morningstar
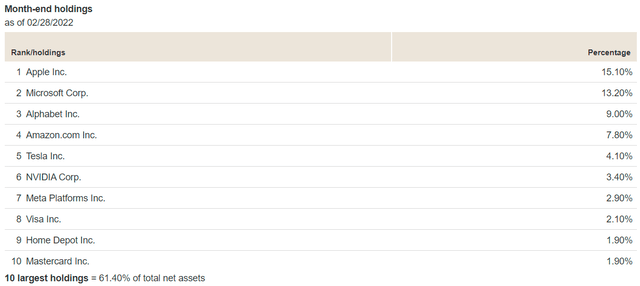
I’ve also listed MGK’s top ten holdings below, which total 61.40%. Unfortunately, Vanguard only updates these percentages monthly, but it’s still pretty accurate.
Vanguard
Historical Performance
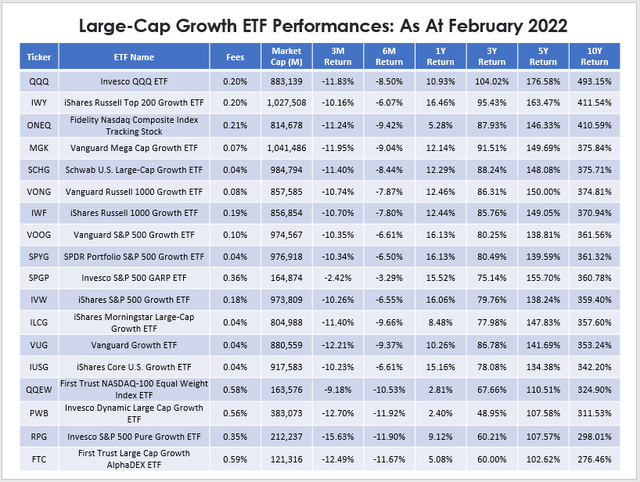
My thesis mentioned how MGK had been a top-performer in the large-cap growth category over the last ten years. The table below clarifies this; pick a period, and you’ll likely find MGK near the top. With few exceptions, the market has favored these highly profitable growth stocks in the last decade, and the phrase “bigger is better” certainly seems to apply here.
Author
Notice the high correlation between the weighted-average market capitalization and performance. It’s no coincidence, just good old fundamentals at work. Mega-caps are generally the most profitable, and according to Seeking Alpha’s Profitability Grades, MGK ranks second out of the ETFs listed above. It’s slightly behind IWY but slightly ahead of the three S&P 500 Growth ETFs (VOOG, SPYG, and IVW).
One ETF stands out for different reasons: the Invesco S&P 500 GARP ETF (SPGP), which has a weighted-average market capitalization of just $165 billion. Its long-term returns are also strong, but look how better it did in the last three months. From November to February, SPGP lost 2.42%, or 9.53% better than MGK. SPGP also trades at about 14x lower forward earnings than MGK, so it’s an excellent example of why valuation still matters. The purpose of this article isn’t to discourage growth investing as a strategy but to encourage them to consider valuation, too.
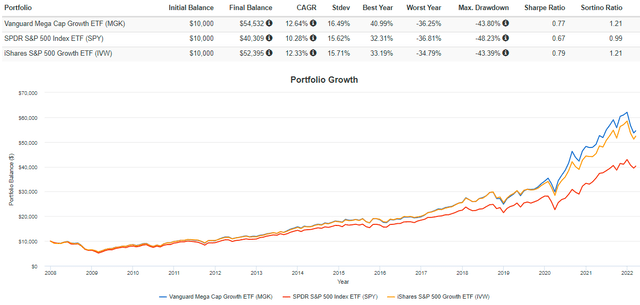
Finally, the graph below takes us back to MGK’s inception date to capture its returns during the Great Financial Crisis. We haven’t had many sustained drawdowns in the last ten years, so it’s helpful to see the potential risks.
Portfolio Visualizer
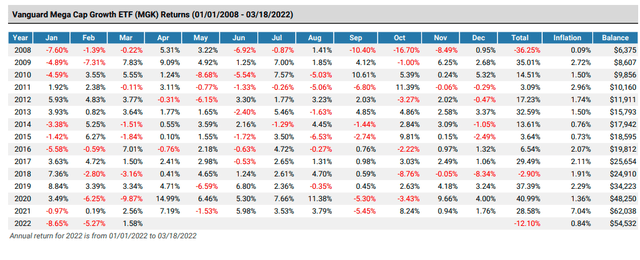
Investors may be surprised to learn that the two growth ETFs had less drawdown than the SPDR S&P 500 Index ETF (SPY) from January 2008 to February 2009. A 43.80% loss still hurts and considering valuation can help limit further losses. As shown in the graph below, it’s possible to have multiple poor months in a row. Two consecutive negative months happen most years, and the critical question is whether or not we’ll have a year like 2011 or 2018, or if this latest selloff is just a normal blip.
Portfolio Visualizer
Fundamental Analysis
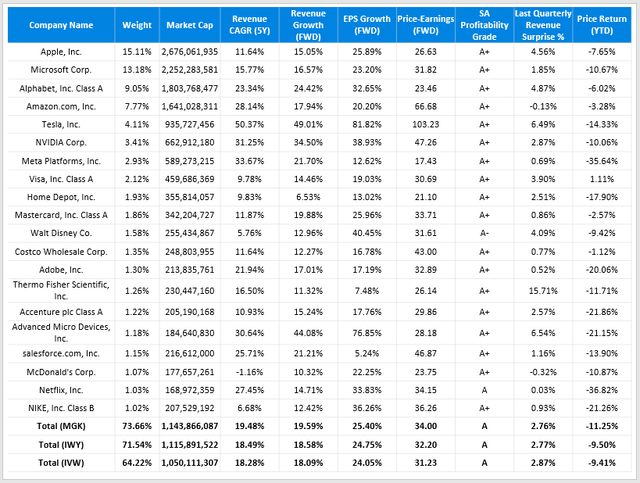
I’ve put together a fundamental analysis highlighting MGK’s top 20 holdings metrics. I’ve also compared these metrics with IWY and IVW, showing that MGK is more expensive on a forward earnings basis.
Author
These three ETFs have a lot of overlap but have very slight allocation differences caused by changes in concentration levels. For example, MGK is overweight in six key industries relative to the more diversified and cheaper IVW:
- Data Processing & Outsourced Services (Visa, Mastercard, PayPal)
- Movies & Entertainment (Walt Disney, Netflix)
- Technology Hardware, Storage & Peripherals (Apple)
- Interactive Media & Services (Alphabet, Meta Platforms, Snap)
- Hotels, Resorts & Cruise Lines (Booking Holdings, Airbnb, Marriott)
- Restaurants (McDonald’s, Starbucks, Yum! Brands)
Of course, not all of these companies have negative outlooks. However, I think it represents additional risk. I’m not bullish on stocks like Netflix (NFLX) and Meta Platforms, and any of the travel and restaurant stocks have uncertain futures due to the risk of the BA.2 variant spreading.
Still, the main takeaway is that growth investors can get about the same level of earnings growth with other cheaper ETFs without sacrificing profitability. Profitability is why these companies are successful and will continue to be, but you shouldn’t ignore valuation.
Investment Recommendation
Mega-cap growth investors have been successful over the last decade because they have picked the most profitable companies, whether intentional or not. The reason mega-cap stocks are where they are today is no accident, and I don’t buy the narrative that the market has ignored fundamentals for so many years. They will rebound and perhaps emerge even stronger. However, it’s a matter of valuation for me. If there’s an ETF with similar growth features and performance history trading at a cheaper valuation, I can’t ignore that fact. That’s the main reason for my neutral rating today.
Finally, I want to acknowledge the vast majority of Seeking Alpha authors bullish on MGK. I read most of the articles, and many linked the strength of the mega-caps to their extraordinary profitability levels as I have. They’re not wrong, but all show underperformance relative to SPY since their articles were published. I believe the first fundamental signal of market weakness was during the Q3 2021 earnings season when earnings surprises declined for the second consecutive quarter. Since this earnings season began near the end of October, the Vanguard Mega Cap Value ETF (MGV) outperformed MGK by nearly 14%. Now that we’ve had three consecutive quarters of declining earnings surprises, I don’t think it’s appropriate to speculate that the bottom is in just yet.
In summary, regardless of whether you’re a growth investor, MGK is one of the more richly-valued large-cap growth ETFs. If you’re inclined to believe the market selloff is over, you’re better off owning an ETF like IWY or IVW. It has virtually the same upside potential as MGK, but its lower P/E means better downside protection should you be wrong. It’s all a game of probabilities, and MGK isn’t your best bet today.
[ad_2]
Source links Google News

