[ad_1]
krblokhin/iStock Editorial via Getty Images
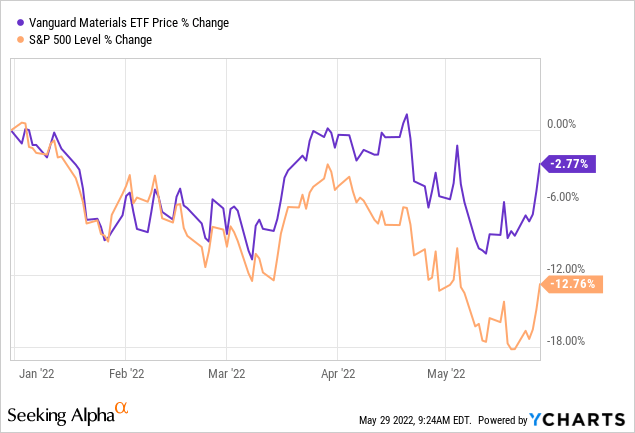
The combination of high inflation and weak equity markets has investors searching for hedges to mitigate the overall impact on their portfolios. Rising materials prices appear to be a promising option worth considering. Today I’ll take a look at the Vanguard Materials ETF (NYSEARCA:VAW) – which has outperformed the S&P 500 by ~10% since the beginning of the year (see graphic below). Like most Vanguard funds, the VAW ETF has a relatively low expense ratio (0.10%), is very well capitalized (market cap $5.1 billion), and has a relatively solid long-term performance track record: a 10-year average annual return of 11.1%. So, let’s take a closer look at the Vanguard Materials ETF today and see if it might be worthy of an allocation within your portfolio.
Investment Thesis
As you know, inflation is raging as a result of several macro developments: the impact of the pandemic (both demand from the re-opening theme as well as continued supply-chain disruptions), high spending by governments across the globe to mitigate the economic impact of the pandemic, as well as Putin’s war-of-choice and the resulting sanctions placed on Russia by the United States and its Democratic & NATO allies which has effectively broken two of the planet’s most critical supply-chains: energy and food (see MOO: Agribusiness – Because The Global Supply-Chain Is Broken).
As a result, commodity and materials prices are skyrocketing. Indeed, construction materials – year on year – are up the most in 50 years. Indeed, construction material costs were up 17.5% from 2020 to 2021. Statista reports significantly increases in diesel, asphalt, and ready mixed concrete.
That being the case, many investors might consider a good materials ETF to get exposure to rising prices through a diversified portfolio of materials producers. Let’s take a look at the Vanguard Materials ETF: VAW.
Top-10 Holdings
The top-10 holdings in the VAW ETF are shown below and equate to a moderately diversified ~48% of the entire 115 company portfolio:
Vanguard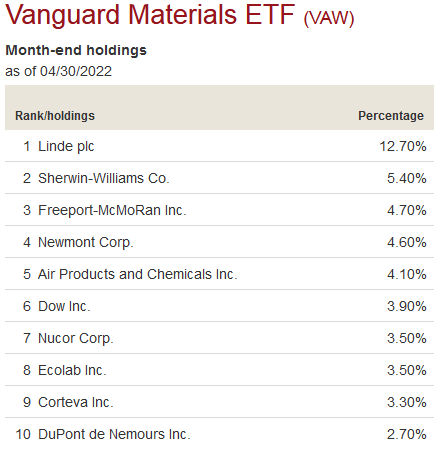
The first observation I have is rather obvious, but in my experience it is quite unusual to see a Vanguard fund like VAW to be so over-weight its #1 holding. That being the case, I was quite surprised to see Linde plc (LIN) has a 12.7% weight – more than double that of the #2 holding Sherwin-Williams (SHW) and its 5.4% allocation.
However, after taking a closer look at Linde – a global leader in industrial gases and engineering – I can see why. Note that Linde was growing nicely before the pandemic and acquitted itself quite well during the pandemic:
Seeking Alpha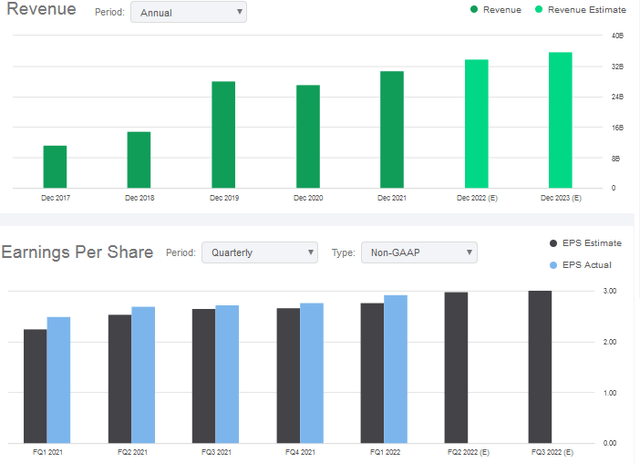
Linde’s Q1 EPS report (Non-GAAP EPS of $2.93/share) was a beat on both the top- and bottom-lines, although the company has warned investors that it is winding down engineering projects in Russia, which accounted for ~1% of revenue in 2021 and had a ~$350 million impact on Q1 sales – making the top-line beat even more impressive in my opinion.
Linde pays a $4.68/share annual dividend, currently yields 1.4% and trades with a forward P/E of 27.7x. LIN stock is up 9.6% over the past year, besting the S&P 500 by ~9.2%. Morgan Stanley recently named Linde one of the best 15 stocks to “weather a bear market”.
With a 4.7% weight, Freeport-McMoRan (FCX) is the #3 holding. Freeport is a geographically diverse miner of copper, gold, molybdenum, silver, and other metals. FCX is actually down 6.6% over the past year and is trading with a forward P/E of only 10.3x. That is somewhat surprising to me given how strong copper prices have been of late as compared to the pre-pandemic age and the continued bullish forecast for EV sales growth:
Nasdaq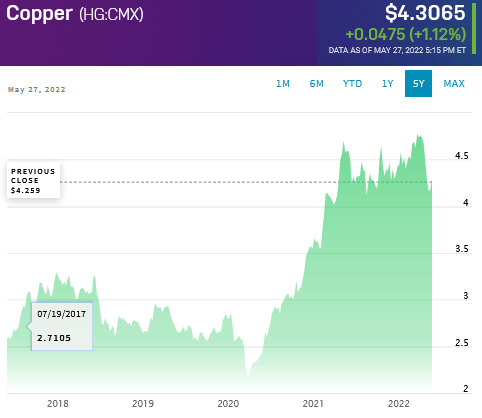
Air Products and Chemicals (APD), which provides atmospheric gases (oxygen, nitrogen, and argon) as well as industrial process (hydrogen, helium, carbon dioxide, carbon monoxide) and specialty gases, is the #5 holding in the VAW ETF with a 4.1% weight. APD is down 16% over the past year and is currently yielding 2.6%.
Steel producer Nucor (NUE) has a 3.5% weight and is the #7 holding. Nucor is up 36% over the past year yet still has a very low forward multiple of only 5.3x.
The top-10 list is rounded out by materials technology and materials supplies provider DuPont (DD), which is down 19% over the past year and currently yields 1.9%.
As for the overall portfolio, the highest weighting is in the specialty chemicals sub-sector (roughly one quarter of the entire portfolio’s allocation), followed by industrial gases (16.8%), with commodity gases & steel – both tying for 3rd place with a 8.7% weight:
Vanguard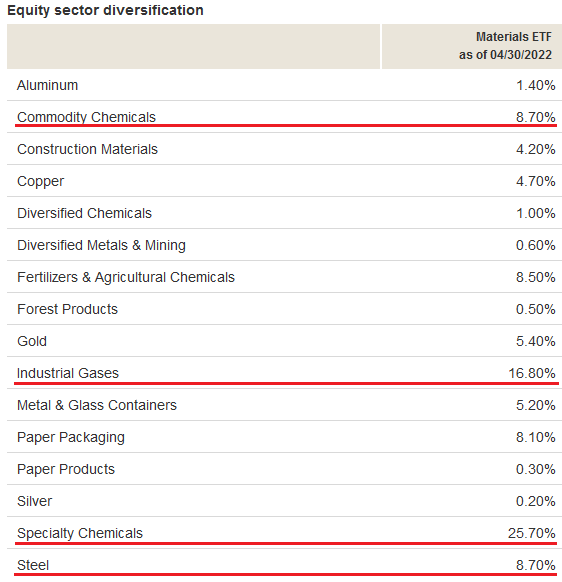
It is somewhat surprising and disappointing to me that the “fertilizers & agricultural chemicals” sub-sector weighting is not higher (only 8.5%).
Valuation
Some common valuation metrics of the VAW ETF are shown below:
Vanguard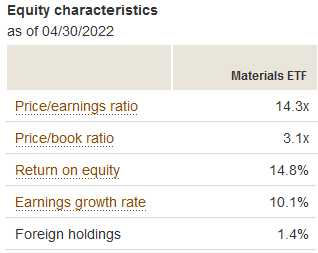
The portfolio is at a rather deep discount to the S&P 500, which currently has an average P/E ratio of 21x and a price-to-book ratio of 4.1x. Meantime, the S&P 500 has an earnings growth rate of 18% in Q1, as compared to a TTM earnings growth rate of 10.1% for the VAW ETF.
Performance
The VAW ETF has a solid, if unspectacular long-term performance track-record:
Vanguard
Risks
The VAW ETF is certainly not immune to the macro-environment risks: the lingering impact of the global pandemic, high inflation, a rising interest rate environment, and the impact of Russia’s war-of-choice on the global energy & food supply-chains. In fact, the biggest risk to the VAW ETF might well be an economic contraction and global recession due to high inflation and higher interest rates; that would cause demand destruction for the materials produced by the companies in the portfolio.
Upside risks include a generally still undervalued sector as compared to the S&P 500, even higher materials prices going forward, and the Fed potentially executing a soft-landing and preventing a recession.
Summary & Conclusion
First off, you’ve got to be comfortable and bullish on Linde plc considering that 12.7% of VAW’s portfolio is allocated to the company. And while that doesn’t bother me too much because I like Linde’s prospects, it does bother me that a copper producer like FCX is actually down 6.6% over the past year. This could be the market’s way of anticipating a serious global slowdown in demand and a possible recession. And while I generally like the VAW portfolio’s holdings and its relatively low valuation level, the performance isn’t what I would have expected given the inflation narrative.
In fact, I would go so far to say that if an investor wants a hedge against inflation, the energy sector might still be a better place to look despite its out-performance year to date: note the Energy ETF (XLE) is up 55% since the start of the year. I say that because the outlook for strong oil and gasoline – and especially diesel prices – going forward seem to be a much surer bet than many of the materials makers face. A refiner like Phillips 66 (PSX), which has one of the largest coking capacities in the refining space, appears ideally positioned to benefit from higher diesel prices. Plus, PSX currently yields 3.6%.
That being the case, I’ll pass on the VAW ETF (rate it a HOLD) and suggest investors searching for an inflation hedge continue to look toward the energy sector instead. Indeed, in addition to Phillips 66, I’d rather own integrated O&G company Chevron (CVX) for its LNG production and even Exxon (XOM), both of which still have excellent potential for continued capital appreciation while also throwing off decent income (3.2% and 3.6%, respectively).
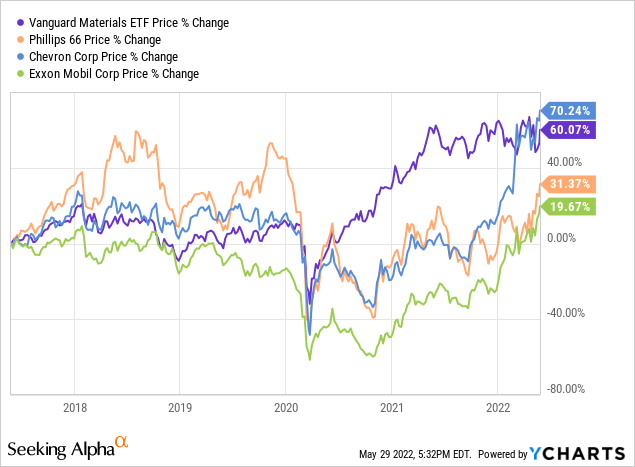
I’ll end with a five-year price chart of the VAW ETF versus the S&P 500, PSX, CVX, and Exxon and note that only Chevron is ahead of the VAW ETF:
[ad_2]
Source links Google News

