[ad_1]
marchmeena29/iStock via Getty Images
Thesis
The article is entitled “Beware The Ides Of March” yet we are in June – what gives? Just like Julius Caesar should have heeded the warning received regarding his assassination, investors should be aware that the current bear market is not over and a leveraged vehicle betting on the rise of the S&P 500 Index is not an ideal holding for the next few months.
It has been a brutal start for the year in the stock market with the S&P 500 index down -20.8% year to date while the Dow is down only -16.12% (as of the writing of this article). The ProShares UltraPro S&P500 (NYSEARCA:UPRO) is a leveraged exchange-traded fund (“ETF”) that offers investors daily investment results that correspond to three times (3x) the daily performance of the S&P 500 Index. In a rising market UPRO can turbo-boost an investor’s portfolio by virtue of its embedded leverage. In effect, an investor with only $100 of capital ultimately receives the S&P 500 return for $300 of capital. UPRO is a great tool in upwards sloping markets, but a loss magnifier during a bear market.
Current Market
These are the stages of a bear market:
Stages of a Bear Market (Hofstra University)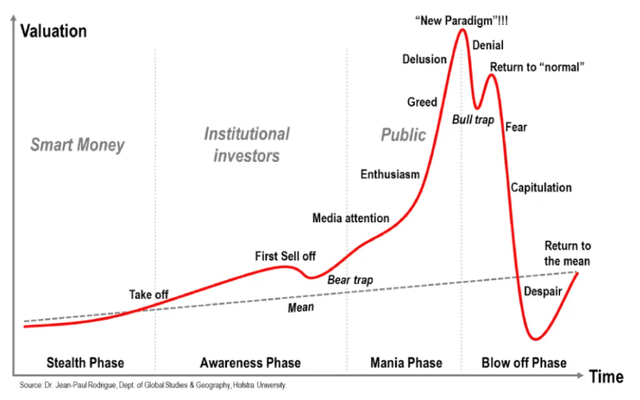
An informed reader might already have an opinion on this. We think we just witnessed the “fear” leg of the market but we are yet to see capitulation and despair. From a technical standpoint, oversold conditions prevail and we are due for a bounce. We might be up another 3-4% before the next leg of the structural bear market kicks in. Oversold conditions are captured by indicators such as the Relative Strength Index, which is currently hovering around 40:
The relative strength index is a momentum indicator used in technical analysis that measures the magnitude of recent price changes to evaluate overbought or oversold conditions in the price of a stock or other asset. The RSI is displayed as an oscillator (a line graph that moves between two extremes) and can have a reading from 0 to 100. The indicator was originally developed by J. Welles Wilder Jr. and introduced in his seminal 1978 book, “New Concepts in Technical Trading Systems.”
Source: Investopedia
It ultimately boils down to the fact that both an upwards and a downwards move in the stock market is not unilateral, but often follows a wave type pattern. If a bear market was composed of the index falling every day by -1%, then all market participants would recognize the pattern and act accordingly.
During a “free money” zero rates monetary policy, valuations did not matter with all stocks pumped up by retail cash. Things have changed, and suddenly valuations are of importance and analysts are again talking about P/E ratios and normalized historic multiples. Goldman Sachs gives us a nice visual representation of various permutations between P/E Ratios and earnings:
GS Scenarios (Goldman Sachs)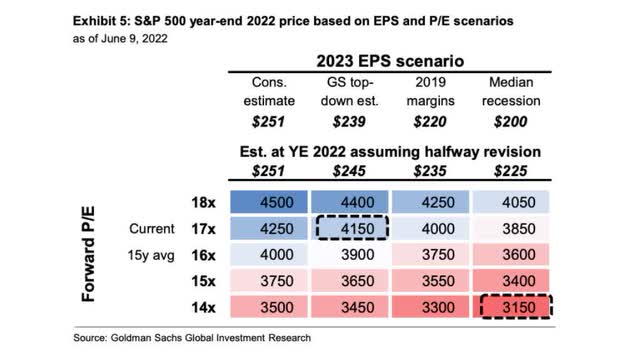
Looking at historic P/E ratios, we can see that the average P/E ratio is about 15.5, as per Yardeni Research:
Historic P/E Ratios (Yardeni Research)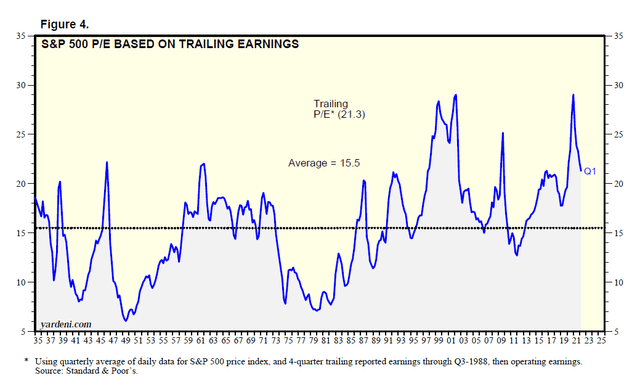
At this stage assessing earnings given the rise in rates, supply chain issues and commodity prices is a bit of a guessing game. Assuming we are going to revert to the 2019 margins (i.e., $225 EPS) and utilizing a 15x P/E multiplier gets us towards the bottom right side of the Goldman box, namely somewhere around a price of 3,400 for the S&P 500.
UPRO as a Trading Tool
UPRO is a leveraged ETF. Like any leveraged product, we feel that it should be used as a trading tool rather than a permanent buy-and-hold component of an investor’s portfolio. However, due to the fact that the stock market has generally been upward-sloping in the past decade, UPRO has generated positive long term results as well (both on a 3- and 5-year lookback period). Moreover the vehicle has a high 5-year Sharpe ratio of 0.65.
That is where the good part ends. Due to its leverage, UPRO has a massive 51.5 standard deviation and stomach-churning drawdowns. We expect another -10% leg in the S&P 500, therefore, this should translate into another -30% for UPRO.
Analytics
Assets under Management (“AUM”): $2 billion
Sharpe Ratio: 0.65 (5-year)
Standard Deviation: 51.5 (5-year)
Expense Ratio: 0.91%
Holdings
The ETF replicates the S&P 500 daily performance, leveraged, mainly via swaps:
Holdings (Fund Fact Sheet)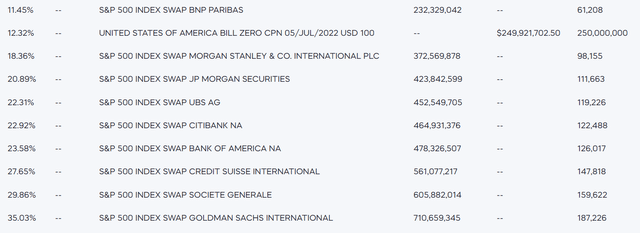
Swaps are cleared via clearing houses and hence there is no structural counterparty risk undertaken at the ETF level. To that end, if any of the large banks would default, the ETF would not incur any losses.
Performance
The ETF is down more than -54% year to date:
YTD Total Return (Seeking Alpha)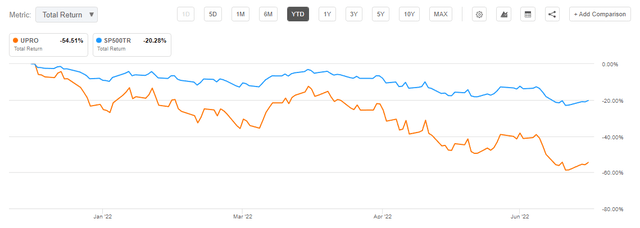
On a longer term basis, the vehicle is still up given the structural bull market in stocks that we witnessed:
3-Year Performance (Seeking Alpha)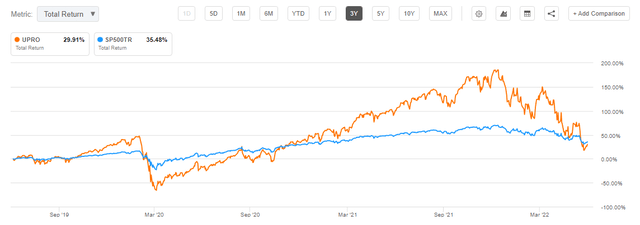
A 5-year graph paints a similar picture of positive performance:
5-Year Performance (Seeking Alpha)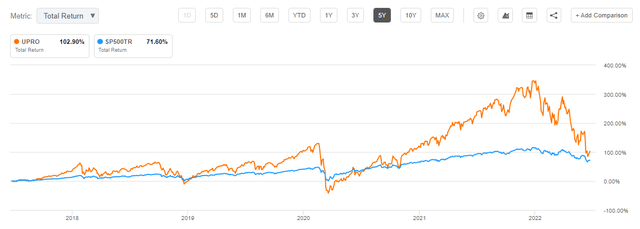
One can argue that for a more sanguine, risk tolerant investor, UPRO can represent a buy-and-hold investment. We are of the opinion that leveraged products should be used as trading tools only, with defined price targets and holding periods. Our view is driven by a portfolio construction approach where an investor should target a specific standard deviation and drawdown metrics for the portfolio. UPRO has a very high standard deviation and prohibitive drawdown profiles.
Conclusion
UPRO is a leveraged ETF that offers an investor 3x the daily move in the S&P 500 Index. The vehicle is down substantially in 2022 (more than -54% as of the writing of the article) but has recouped some losses in the past few days on the back of what we feel is a technical bounce in the index. We believe we are in a bear market and we just witnessed the “fear” leg unfold. After the current technical move up, we expect another -10% leg in the S&P 500 that should roughly translate into another -30% move for UPRO.
[ad_2]
Source links Google News

