")
[ad_1]
A few weeks ago, I wrote a piece about the iPath S&P GSCI Crude Oil Total Return Index ETN (NYSEARCA:OIL). In my analysis, I argued that the crude fundamentals were bearish, and that when fundamentals are bearish, the market structure of WTI futures would negatively impact holders of OIL. In this piece, I am going to update my analysis in light of the most recent fundamental information and point out that crude is now fundamentally bullish and market structure is starting to favor holding a position in OIL.
Before jumping into our analysis, it pays to have a refresher on what OIL actually does. If you’re going to hold something, it makes a lot of sense to know exactly what it is and the risks associated with it. First the OIL ETN seeks to track the S&P Crude Oil index. A simple read through the prospectus and methodology of the S&P Crude Oil Index will show that this means a position in OIL is exposed to roll yield.
As I mentioned in my last piece, roll yield negatively impacts OIL when the market is in contango and positively impacts it when the market is in backwardation. The basic tendency of futures markets is that in general, prices tend to converge towards the front-month futures contract as time nears expiration. This means that when the market is in contango, an investment holding positions across a few months will experience negative roll yield as its investments in back months converge towards those in front months by decreasing in value. When the market is in backwardation, the opposite happens in that back-month futures contracts will rally towards front-month prices, increasing the value of holdings.
The relevance for our OIL investment is this: since the crude fundamentals have now turned bullish, backwardation has entered the crude market once again. This means that investments exposed to roll yield like OIL will experience a constant positive headwind, potentially offsetting outright declines in futures pricing. The reality of this relationship can be seen in the following chart.
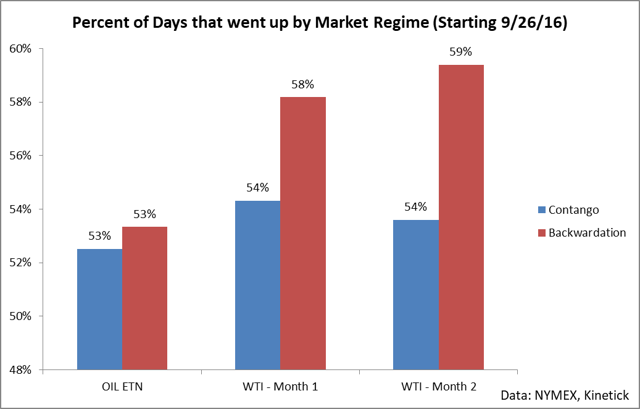
This chart is an analysis of the percent of days in which the OIL ETN and the front two months of WTI closed up or down segmented by if the market was in contango or backwardation. There isn’t much market data for OIL in that it started trading in late 2016, but during that time period, the relationship has started to emerge quite clearly. When the market is in backwardation, not only is WTI likely to increase, but also futures contracts further out on the curve have an even greater likelihood of increasing.
The relevance to OIL is this – over the last week, we have entered backwardation once again.
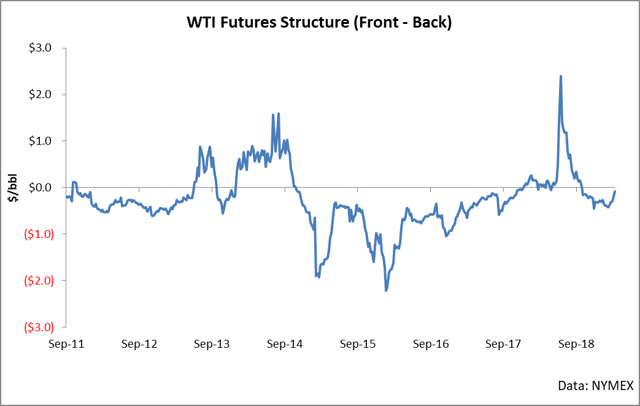
When the market is in backwardation, not only is the flat price of WTI likely to increase on a daily basis, but also the contracts further out on the curve are even more likely than contracts in the front. OIL tracks an index which holds investments spread across multiple months, so during periods of rolling positions, OIL will benefit from this relationship. A longer-term chart of the difference between the front two contracts gives additional perspective on this relationship and shows how rare periods of backwardation generally are. For example, in the last 10 years, only about 22% of all months have been in backwardation meaning that this is a noteworthy regime switch occurring right now in the crude markets.
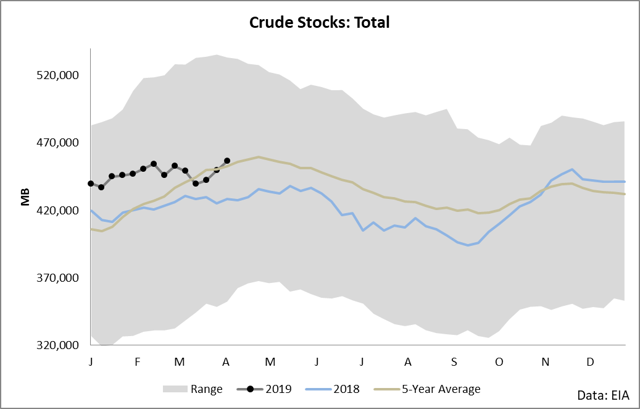
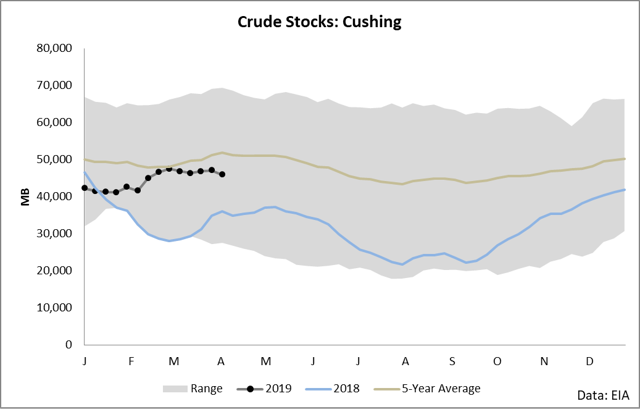
The fundamentals which are driving this relationship are quite simple really. Crude demand has finally picked up to the point where the market is indicating that it is short in the prompt months. We saw a strong build in crude this week bringing us back above the five-year average, but the last two months have seen a bucking of the trend as inventories have been flat when traditionally they seasonally build this time of year.
Cushing stocks (where WTI is priced) have slowly started drifting away from the five-year average after remaining beneath it all year.
For holders of OIL, the importance of undersupply and supply situations which go against the seasonal average is this: it is directly related to both the market structure and the flat price direction of crude oil.
First, there’s a direct relationship in the direction of crude inventories and flat price. As you can see in the following chart, when crude is building, price is falling. When crude is drawing, price is rising.
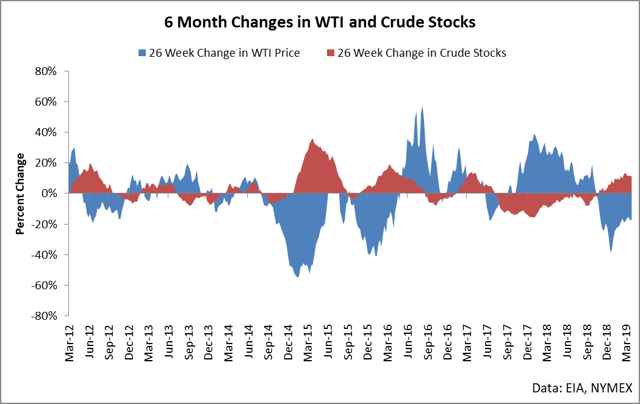
We are entering a situation in which stocks are going flat and heading towards a decline once again. When this happens, we are likely to see an increase in the flat price of WTI. When WTI increases in price, OIL will increase in that it tracks an investment in WTI futures.
Secondly, there’s a direct correlation between the difference in crude inventories to its five-year average and the market structure of crude.
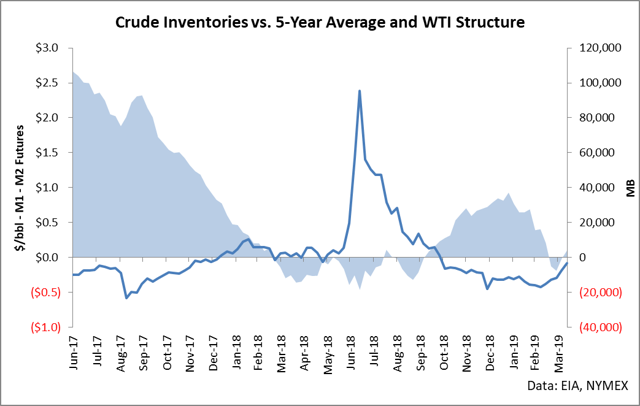
As seen in recent weeks, crude inventories have fallen beneath their five-year average (shaded region). When this historically happens, the market trades into backwardation (line on chart). This chart is tracking weekly data synced with the EIA release date, so it won’t show the switch into backwardation seen over the last few days, but a historic look at the decline of late 2017 through late 2018 shows what happens when inventories draw down beneath their average: the market trades into backwardation.
Holders of OIL have these two headwinds: the fundamentals are supportive of further price upside in WTI futures and the fundamentals are supportive of a backwardated market. While these two variables remain in effect, I expect the price of OIL to rally both from price appreciation of WTI futures and from roll yield. I expect this relationship to remain in place at least through the end of driving season (late summer). The reasons here are that we are entering a period of historic drawdowns and we’re doing so from a position of weakness in that inventories have already been bucking the seasonal trend in builds/draws. If we have a normal driving season with the same level of exports and decreased imports we have been seeing as of late, we will see inventories draw strongly in the coming weeks. This bodes well for holders of both futures and OIL.
I suggest holding OIL until the market regime shifts – and I don’t believe we’ll see that for at least 4-5 months.
Disclosure: I/we have no positions in any stocks mentioned, and no plans to initiate any positions within the next 72 hours. I wrote this article myself, and it expresses my own opinions. I am not receiving compensation for it (other than from Seeking Alpha). I have no business relationship with any company whose stock is mentioned in this article.
[ad_2]
Source link Google News