[ad_1]

AdShooter/E+ via Getty Images
The charts in this article build on the (somewhat different) leveraged ETF decay pricing methodology that I have tried to explain in my previous articles (see here and here). Please note that I am not expressing any views whatsoever on the likely price movements or weightings in the underlying indices (including SPY, VOO, VB, and semiconductor indices). I am specifically only looking at the investment decision relating to the holding costs of LETFs relative to other lower-cost LETF (less expensive) alternatives that provide an equivalent market exposure. The objective is only to reduce LETF holding or decay costs in times of a market correction, not to time the market or suggest sector weightings (other than to highlight that certain illiquid, difficult to hedge sectors incur significantly higher LETF decay costs than SPY, VOO and QQQ).

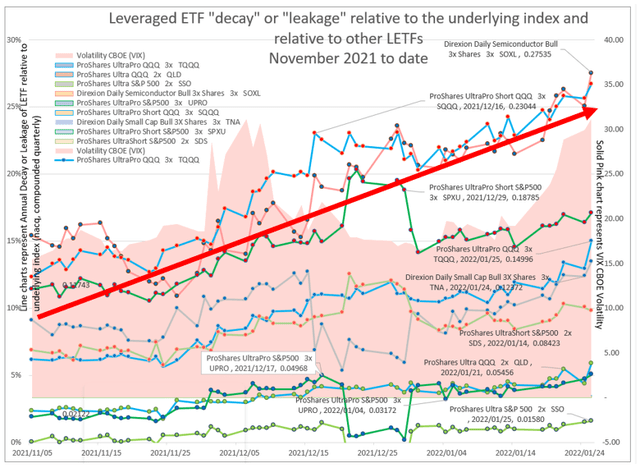
Figure 1: Leveraged ETF “decay” or “leakage” relative to the underlying index and relative to other LETFs: November 2021 to date (Model Source: Author, Data source: Excel 365 Stocks function)
Author
Leverage ETF decay costs have doubled
Leverage ETF decay costs have doubled in the last 3 months and the trend is expected to continue. But LETF leakage costs are still very low compared to March 2020.
Liquid LETFs still offer very inexpensive access to leverage
2X ProShares Ultra S&P 500 (ARCX:SSO) will leak only 1.5% per year relative to holding SPY or VOO. SSO still represents a very inexpensive form of gearing/leverage.
Difficult to hedge LETFs are expensive
However, 3X Direxion Daily Semiconductor Bull (ARCX:SOXL) LETF at current levels will lose 27% of its investment value to decay costs every year relative to an investment into the 1X iShares Semiconductor (XNAS:SOXX) assuming a sideways movement for SOXX for a year. This 27% capital loss is a very big investment loss (and a material investment decision) compared to the investment decision to invest direct into the SOXX Semiconductor index. SOXL is expected to perform very poorly relative to an investment in the unleveraged SOXX ETF index in these sideways or downward market conditions.
These leakage/decay cost charts should not be confused with the price charts.

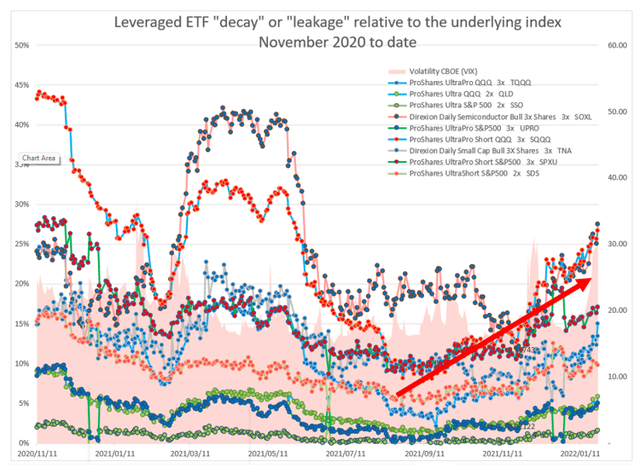
Figure 2: Leveraged ETF “decay” or “leakage” relative to the underlying index and relative to other LETFs: November 2020 to date (Model Source: Author, Data source: Excel 365 Stocks function)
Author
LETF decay costs are directional
LETF decay costs appear to follow a directional path over time and are subject to directional momentum. LETF costs contain a fixed or sunk cost component relating to their underlying Total Equity Return Swap hedging, which might comprise long-term (five-year) hedging swaps. Swap costs appear to be spread or amortized for some time after the initial index price drops.

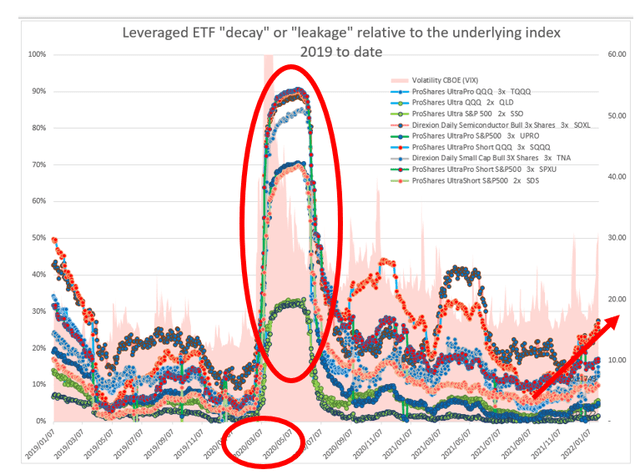
Figure 3: Leveraged ETF “decay” or “leakage” relative to the underlying index and relative to other LETFs: January 2019 to date (Model Source: Author, Data source: Excel 365 Stocks function)
Author modeling
LETF costs lag market corrections
Looking at the red circles in Figure 3 above, at various points in the above charts you will observe that the LETF costs appear to lag the volatility spikes. This lag can also be observed in Figures 1 and 2 and is more comprehensively analyzed in my previous articles. The volatility spike in the solid filled pink chart above corresponds to the violent COVID-19 March 2020 sell-off. You will also notice that LETF decay costs only started climbing dramatically in April 2020 (six weeks after the start of the crash).
A closer look at the data reveals that LETF decay costs stayed constant and very low from Feb. 19, 2020, right until the bottom of the trough on March 20, 2020. That’s possibly thanks to the long-dated swaps that had been (inexpensively) been put in place prior to the crash that continued to do their job and hedge ProShares UltraPro QQQ 3X (TQQQ) and the Leveraged ETFS for some time after the crash. You will also notice that LETF costs continued to be very high for some time after April 2020 until July 2020 (whereas volatility levels and index prices had recovered very quickly by end April 2020).
Decay costs might not be covered by the bull recovery this time
These leakage/decay cost charts should not be confused with the price charts. In 2020, the very significant LETF decay costs were fortuitously well-covered in multiples by one of the most rapid recoveries in history. However, if we are expecting a prolonged sideways index market movement in terms of continued COVID impact, accelerated Fed hawkish policy, and Ukraine uncertainty, then expect a significant portion of your LETF investment to be consumed by decay costs. My view is that it is time to derisk your LETF positions – i.e., move away from costly LETFs.
If you have spare cash, move away from 3X to 2X LETFs, move away from esoteric LETFs (e.g., oil, gold, semiconductor, difficult to hedge LETFs, small cap LETFs) and into Nasdaq and S&P LETFs. And, if possible, avoid holding short LETFs for any protracted period. We are still enjoying relatively low LETF decay costs, but my view is that we are going to see a spike in LETF costs (which decay costs lag market price corrections and volatility spikes)
$150 into 2X LETFs is significantly less costly than $100 into 3X LETFs (and 2x LETFs track the underlying more accurately)
2X LETFs SSO and QLD incur decay costs of approximately on third of the other 3X, illiquid and short LETFs. From April 2020 to June 2020, SSO and QLD incurred annualized decay costs of roughly 30% (nacq) (currently 1.5% nacq) whereas the other LETFs incurred decay costs of up to 90% (nacq) of their investment values (3X TQQQ decay costs currently 15%nacq). Fortunately, this spike in costs only lasted 3 months from April 2020 to July 2020 so the impact of high decay and LETF holding costs did last long. Also, more fortuitously, during the subsequent recovery, TQQQ prices ran up tenfold (from $18 to $180 (prices prior to TQQQ stock split)) which masked the significant decay costs, but investors might not be as lucky this time. This bull market masking of decay costs will not happen in a sideways or bear market and these costs might be significant and might be sustained for some time.
$100 TQQQ vs. $150 QLD
This article is not intended to express views on the underlying indices. My personal very long-term investment philosophy is that I want to be long and stay long the markets. I believe in the long-term positive gearing effect of equities relative to interest rates, so long LETF positions (unhedged) for a small at risk portion of my portfolio are carried through market corrections. I believe that, in the long run, equities offer the best inflation hedges. I don’t believe in trying to time the market: My preference is to stay long the indices at a constant exposure through all cycles. Having said that, it makes absolutely no sense to be long $100 in TQQQ and sit with $50 cash. Rather, it’s best to sell the TQQQs and invest all $150 in QLD for the same underlying market exposure at significantly reduced holding/decay costs.
If and when the market recovers, I look forward to running the ($100 TQQQ + $50 cash) vs. ($150 in QLD) scenarios to quantify the differences between the two investment decisions (as well as for other indices) to see whether the 2020 pattern repeats.
3X LETF data analysis:
- ProShares UltraPro QQQ 3X TQQQ
- Direxion Daily Semiconductor Bull 3x SOXL
- Direxion Daily S&P 500 Bull 3X (SPXL)
- ProShares UltraPro S&P500 (UPRO)
- ProShares UltraPro Short QQQ (SQQQ)
- Direxion Daily Small Cap Bull 3X (TNA)
- ProShares UltraPro Short S&P500 (SPXU)
2X LETF data analysis:
- ProShares Ultra QQQ (QLD)
- ProShares Ultra S&P 500 SSO
Q&A: LETF investment decisions in times of market corrections
I recently tried to answer some reader questions that are relevant to leveraged ETF investment decisions during market corrections.
Question: [What happens] if QQQ dropped more than 33% in any day, not TQQQ? Since the latter targets three times the return of the former, a drop >33% in one day for QQQ would theoretically wipe out the TQQQ position.
Answer: Very good question – if QQQ dropped by 36% (i.e., to 74% of its original value) in March 2020 then the TQQQ theoretical loss is calculated as (1-36%)^3. In other words, TQQQ should drop to 26% of its original value. This use of polynomial math is necessary because TQQQ is rebalanced daily. (Your understanding would be correct for a 3x geared QQQ without any rebalancing.) My articles on the pricing of LETF decay (linked to above) can provide further explanation.
Question: You said “(1-36%)^3” – I am not familiar with this. Can you type out this formula/equation in words for me?
Answer: (1-36%)^3 means the QQQ devaluation expressed as a factor 1-36% raised to the power three. In a nutshell, using simple 3X(QQQ price movement) multiplier yields exactly the same result as the above polynomial formula for small price movements and for short periods, but the 3X formula diverges considerably over time and for big price movements. The polynomial formula “(1-36%)^3” takes into account rebalancing and compounding of TQQQ. Enter “(1-36%)^3” into Google or a financial/scientific calculator and fiddle around with the numbers and multipliers to compare “(1-36%)^3” to “3*(1-36%)” or “3X(1-36%).”
Question: I am confused by your comparison of QQQ dropping to 74% correlating to TQQQ dropping less than QQQ. Perhaps the symbols [are] reversed? If QQQ drops a percentage, TQQQ will drop 3 times that amount, not less than that amount.
Answer: A 36% drop means that shares are trading at a lower percentage (or lower factor) of their original prices. That lower percentage or lower factor equates to a (1-36%) = 74% of the original prices. Exponents and polynomials use factors (e.g., 74%) whereas the 3X method uses a more simple 3X of losses (e.g., 36%), but the 3x method produces dramatically incorrect results for large price movements. Many LETF authors get this math wrong and use the 3X method – and the LETF prospectuses cloud, mask, exacerbate, propagate this clouding of the very significant (and difficult to calculate) costs imbedded in LETFs. The 3X method is the correct method to use for a buy and hold two-thirds leveraged QQQ position bought on margin account without daily rebalancing or compounding.
But TQQQ price can increase tenfold in 18 months, whereas in a two-thirds leveraged QQQ position the two-thirds margin account borrowing would remain relatively constant (relative to dramatic QQQ price movements). That would have a very dramatic impact on the TQQQ leverage ratio, and throw out and imbalance the TQQQ leverage ratio as QQQ prices change (in the absence of rebalancing of leverage ratios). In a bull market scenario without rebalancing, your numerator (QQQ market value) increases dramatically whereas your denominator (original investment) stays constant resulting in a leverage ratio well above 3X when the market moves up. TQQQ and all other LETFs rebalance their leverage ratios daily (actually continuously) to maintain the 2 or 3 times leverage ratio. Seeking Alpha authors Peijuan Zhu and Alpay Kaya, CFA, use the correct polynomial math, and the correct math is used in most academic articles on LETFs.
But the majority of academics believe that volatility drives the LETF pricing models in a similar way that volatility drives Black-Scholes option pricing models (whereas I don’t believe that volatility drives LETF decay pricing at all). I have tried to explain this in my two LETF TQQQ articles. LETF decay pricing is driven by fixed and sunk Total Return Equity Swap costs (which make up ~95% of the LETF hedging) and these fixed/sunk swap costs usually lag the volatility spikes by some time, and appear to manifest and be incorporated into LETF decay pricing quite some time after volatility spikes. This lag presents a bit of an arbitrage opportunity in that we are still benefiting from relatively cheap leverage. This means that LETF decay pricing is still relatively cheap at the moment in these volatile times.
Conclusion
Leverage ETF costs have been at very low levels until the recent market corrections. With 20/20 vision in hindsight, low LETF decay costs combined with low costs of synthetic leveraged/gearing embedded in the LETFs have allowed LETF investors to access capital at very attractive rates. Increases in the Nasdaq and S&P indices have, since November 2021, been very efficiently been translated into multiple returns on the underlying indices.
However, LETF leakage/decay costs are now expected to increase significantly. That will result in LETFs underperforming their underlying indices in sideways markets, or amplifying losses above and beyond the 3X or 2X LETF multiples in declining markets. LETF decay costs tend to lag market corrections and volatility spikes, and it is my view (based on historic data in previous articles) that decay costs will increase considerably in the coming weeks. This is a good time to de-risk: Move from 3X to 2X LETFs, and avoid or liquidate positions in high leakage, high decay, high cost LETFs – including esoteric LETFs on less liquid, difficult, costly to hedge indices (including gold, minerals, semiconductors, and financial LETFs). Short LETFs will also become significantly more expensive moving forward.
Post Script (5 February 2022):
Question: So let me get this correct if I invest $1,000 in SOXL for one year based on the way I understand it coming from you I’m going to pay $270 for fees correct me if I’m wrong it just doesn’t sound right thank you:
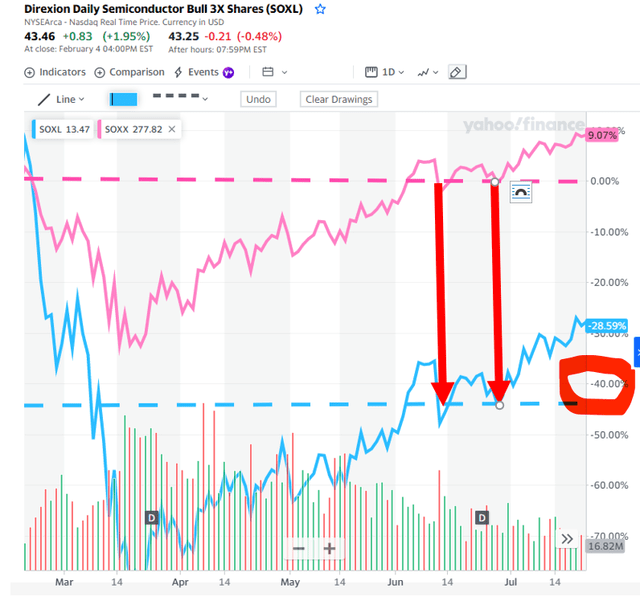
Answer: Good Question.. Please have a look at the following chart which illustrates the leakage of Semiconductor Bull 3X SOXL (blue chart) relative to the Semiconductor index 1X SOXX (pink chart). You will observe that in the pink chart 1X SOXL recovered from the March 2020 crash by Mid June 2020 (while in June 2020 the 3X SOXL chart was still underwater by 45% relative to SOXX). So in those 3 months 3X SOXL underperformed SOXX by 45%!!! (refer red arrows). An investor who bought SOXL on 1 March 2020 would be 45% down relative to an investor who broke bought SOXX on 1 March 2020 and broke even on 15 June 2020. In the absence of any leakage or decay, both SOXX and SOXL would have broken even on 15 June 2020.
Sideways and correction markets give us a rare glimpse, opportunity for visual corroboration of the true decay costs of LETFs (which decay costs can be extremely material, difficult to quantify correctly and masked and hidden in the continued bull market of the last 10 years). Fortunately the extremely high decay costs of March to June 2020 have reduced in multiples but decay costs are notwithstanding very material to investment decisions in current market conditions. Investors fixate of the disclosed 0.95% LETF fees, while the actual leakage or decay costs of LETF can be 30 times higher (largely due to the costs of hedging and leveraging these less liquid indices e.g. the Semiconductor index SOXX). The same visual decay observations can be made for smaller subsequent corrections. Please also note that the 45% decay above occurred over only 3 months and that the annualized decay rate of SOXL relative to SOXX was higher than 45% (refer Figures 1-3 above) but these costs were absorbed and hidden by the bull market.

Figure 4: Visual corroboration of SOLX decay costs (45% in 3 months) of of SOXL relative to SOXX in March – June 2020. (Yahoo Finance)
[ad_2]
Source links Google News

