[ad_1]
Given how poor investment returns were across local and international markets last year, one would expect that a significant majority of local exchange-traded funds (ETFs) and exchange-traded notes (ETNs) would have delivered negative returns in 2018. However, a surprisingly large number showed positive growth over the past 12 months.
Of the 79 products listed on the JSE with at least a one-year track record, 41 showed negative returns for the 12 months to December 31, 2018. That is only marginally more than the 38 that ended the year higher.
The positive performers were however almost exclusively products with exposure to bonds, cash, foreign markets or commodities. Only four funds tracking a JSE-related index finished the year in positive territory.
| JSE-focused ETFs with positive returns in 2018 | |
| Fund | One-year return |
| CoreShares Preftrax ETF | 19.24% |
| Satrix RESI ETF | 16.32% |
| NewFunds S&P GIVI SA Resource 15 ETF | 10.54% |
| NewFunds Shari’ah Top 40 ETF | 3.98% |
Source: Profile Media, etfSA.co.za
By contrast, only three ETFs tracking international equity indices delivered negative returns. This was however entirely due to the weakening of the rand, as international stocks had a poor year in US dollar terms.
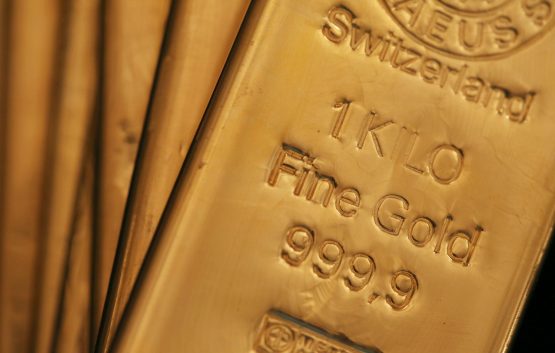
The real star performers were, however, ETFs and ETNs tracking specific commodities. As the table below shows, products linked to the prices of the platinum group metals rhodium and palladium delivered the highest returns last year. Products tracking wheat and gold also made it into the top 10.
| Top-performing exchange-traded products in 2018 | |
| Product | One-year return |
| Standard Bank AfricaRhodium ETF | 64.57% |
| NewPalladium ETF | 39.22% |
| Standard Bank AfricaPalladium ETF | 38.11% |
| Standard Bank Palladium-Linker ETN | 36.04% |
| Standard Bank Wheat-Linker ETN | 27.29% |
| CoreShares Preftrax ETF | 19.24% |
| NewWave USD Currency ETN | 19.06% |
| FirstRand US Dollar Custodial Certificate ETF | 16.36% |
| Satrix RESI ETF | 16.32% |
| NewGold ETF | 15.1% |
Source: Profile Media, etfSA.co.za
This is the second year in a row that the AfricaRhodium ETF has been the top performer. Last year it returned over 100%.
Read: The top ETFs and ETNs of 2017
The continued rise in the prices of rhodium and palladium will be surprising to many, given that the price of platinum has been declining at the same time. The white metal was off nearly 15% for the year in US dollar terms, falling to levels last seen in 2004. It is currently trading below the price it hit during the global financial crisis in 2008.
Palladium and rhodium are however far rarer, given that they are by-products from platinum mining. With major producers such as Impala Platinum cutting back on production, the supply of these metals has become extremely tight. This has encouraged prices higher.
These fundamentals also look unlikely to change in the near term. However, because these are mainly industrial metals used predominantly in the automotive sector, their outlook will depend a lot on the performance of the global economy. If growth slows, so will demand.
Movements in the rhodium price in particular are also very difficult to predict since it trades in very opaque markets. It is only bought and sold over the counter, and there is little data available to investors. It is therefore a rather speculative investment.
Importantly, investors should also appreciate that all three of the palladium and rhodium ETFs track the rand price of the metals. They are therefore also impacted by currency movements.
This is also evident in the gain shown by the NewGold ETF. The gold price actually fell from just over $1 300 per ounce to around $1 280 per ounce over the course of last year, but the ETF showed a decent gain. This was entirely due to a weaker rand.
Rand weakness also led to the gains posted by the NewWave USD Currency ETN and the FirstRand US Dollar Custodial Certificate. Both effectively provide exposure to the dollar-rand exchange rate.
Worst performers
At the other end of the spectrum, the products that showed the largest declines were all exposed to the South African market. The weakest performers were listed property funds, followed by the Satrix Capped INDI.
This is quite a notable turnaround, as the listed property and industrial sectors on the JSE had been top performers for many years. Their recent weakness is once again a lesson to investors that all markets work in cycles. Nothing appreciates forever.
| Worst-performing exchange-traded products in 2018 | |
| Product | One-year return |
| CoreShares Proptrax SAPY ETF | -25.95% |
| Stanlib SA Property ETF | -25.4% |
| CoreShares Proptrax 10 ETF | -25.34% |
| Satrix Property ETF | -22.22% |
| Satrix Capped INDI ETF | -18.2% |
Source: Profile Media, etfSA.co.za
‘);
jQuery(“.ginput_container input”).click(function ()
jQuery(“.gform_wrapper”).addClass(“active”);
jQuery(“#gform_expand”).addClass(“inactive”);
);
jQuery(“#gform_expand”).click(function ()
jQuery(“.gform_wrapper”).addClass(“active”);
jQuery(“#gform_expand”).addClass(“inactive”);
);
});
jQuery(document).on(‘click’, ‘a[href*=”#to-comments”]’, function (event)
event.preventDefault();
jQuery(‘html, body’).animate(
scrollTop: jQuery(jQuery.attr(this, ‘href’)).offset().top
, 500);
);
jQuery(document).ready(function () {
/*
The following handles lightbox expansions of images in the article
*/
//var lightbox_path=lightbox_path||””;!function(a){a.fn.lightBox=function(b){function d()return e(this,c),!1function e(c,d){a(“embed, object, select”).css(visibility:”hidden”),f(),b.imageArray.length=0,b.activeImage=0;var h,e=!1;if(b.grouping&&(h=c.getAttribute(“rel”))&&(e=d,d=[],e.each(function(a,b)h==b.getAttribute(“rel”)&&d.push(b))),1==d.length)if(“gallery”==b.captionPosition)var i=jQuery(c).parent().next().html();else var i=c.getAttribute(“title”);b.imageArray.push(new Array(c.getAttribute(“href”),i))else for(var j=0;j
[ad_2]
Source link Google News

