[ad_1]

fotoslavt/iStock via Getty Images
The NASDAQ 100 ETF (QQQ) has struggled to find its footing over the last few weeks. The last time I wrote on the ETF, I cautioned it had further downside risk, potentially falling to around $342. The ETF exceeded that and fell to a low of $334 on January 24. The shares have rebounded since, but the declines in the ETF are far from over. Specifically, as rates rise and the PE multiple of the underlying index compress.
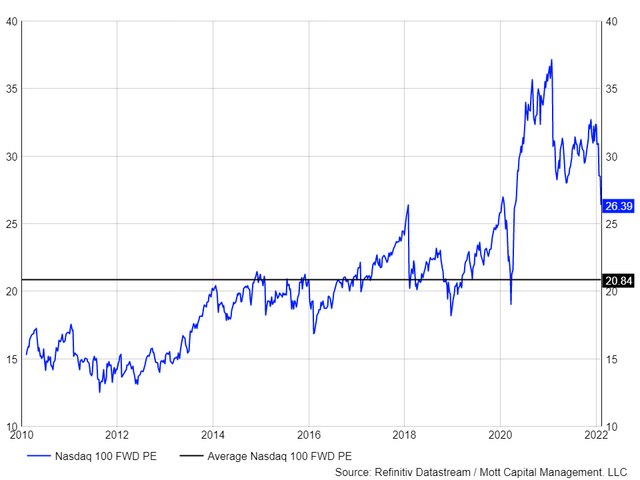
To make matters worse, the underlying index for the QQQ ETF has seen downward earnings revisions since peaking in late September and now stand at $557.31 per share for 2022, which is down from a peak of $562.15, leaving the index and ETF trading at 26.4 times 2022 earnings estimates. While that PE ratio is down sharply, it is historically very high for a forward PE ratio. Going back to 2012 the average is just 20.8

DATASTREAM/ MOTT CAPITAL
Rising Rates
The argument for many bulls is that rates are much lower now than historically, so the higher PE ratio is justified. Newsflash, they were lower. The 10-year rate is currently trading at 2%, which is much higher than just a month ago. The average 10-year yield since 2010 has been 2.2%. The 10-year rate has quickly increased and is nearly back to being in line with its historical average.
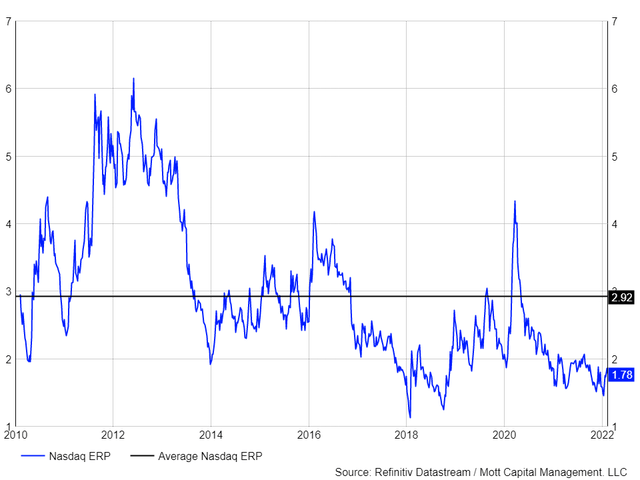
From another perspective, the earnings yield (inverse of the PE ratio) of the QQQ ETF is now 3.8% and places the equity risk premium at 1.78%. Historically, the equity risk premium for the NASDAQ has been at 2.92%. Based on today’s 2% 10-year rate, the NASDAQ should have an earnings yield of 4.92%, nearly 110 basis points higher than it where it is currently. That would push the PE ratio of the QQQ ETF down to 20.3. Assuming earnings of $562.15, the NASDAQ 100 would trade for 11,425, or 22.1% lower than its current level. That would equate to the QQQ ETF dropping to around $278.50 from its current $357.40.

DATASTREAM/ MOTT CAPITAL
Technical Weakness
From a technical perspective, while technically weak, the Qs aren’t likely to drop 22% anytime soon and are more likely to drift lower over the next several weeks. However, it does seem very likely that the Qs not only revisit their recent lows but fall to new lows ahead of the Fed meeting in March, as investors worry about what the Fed is likely to do with interest rates.
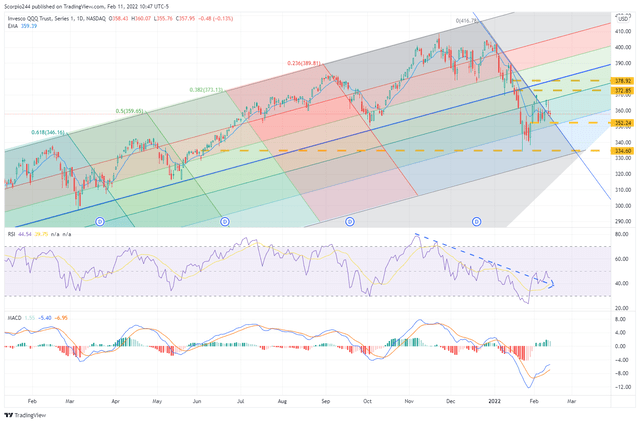
The technical chart shows that a key level of support for the QQQ is at $352, and once that level of support breaks there is very little to hold the ETF up and from returning to its late January lows of $334.60 potentially before the beginning of March.
Resistance for the QQQ is extreme around the $365 level, and it seems unlikely that level will break. There is a lot of bearish momentum, as noted by the declining RSI. Additionally, the MACD is getting close to turning negative and rolling over again, suggesting a further loss of momentum.

TRADINGVIEW
Options Expiration
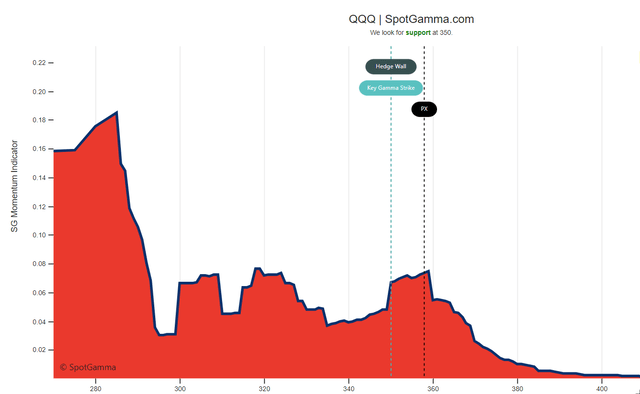
Next week will be the monthly options expiration date which means that volatility should expand as we get closer to options expiration on February 18. The gamma setup for the QQQ ETF is not favorable and shows a drop below $350 is likely to lead to a relatively fast decrease to around $335 based on data provided by SpotGamma.

SPOTGAMMA
So both from an option and technical perspective, there is a reasonably good chance that we do see lower prices in the QQQ ETF over the next week, with the potential for the Qs to fall back to the January lows.
The outlook for the QQQ ETF is no longer as favorable as it once was. Earnings have seen downward revisions on the index level. The PE multiple is still very high historically while rising yields have contracted the equity risk premium making the ETF and index even more overvalued. Finally, the technical and option setups favor further price erosion over the near term.
It seems more likely then than not to see the QQQ ETF not only revisit its lows but make a new one very soon.
Investing today is more complex than ever. With stocks rising and falling on very little news while doing the opposite of what seems logical. Reading the Markets helps readers cut through all the noise delivering stock ideas and market updates, looking for opportunities.
We use a repeated and detailed process of watching the fundamental trends, technical charts, and options trading data. The process helps isolate and determine where a stock, sector, or market may be heading over various time frames.
To Find Out More Visit Our Home Page

[ad_2]
Source links Google News

