[ad_1]

Florencio Horcajo Alvarez/iStock via Getty Images
The Nasdaq 100 ETF (QQQ) has been smashed as rising TIP rates have resulted in a valuation reset as the market prepares for tighter monetary policy. The ETF’s most significant problem in the future is that while many smaller components that make up the ETF have been demolished, the top-heavy ETF hasn’t seen the big market cap stock get hit nearly as hard yet.
That could be a massive problem for the ETF and could ultimately be what causes it to fall further in the future. Additionally, the gamma profile for the QQQ is rather adverse, and it may not take much of a drop to get the QQQ ETF rolling lower.
Valuation Is High
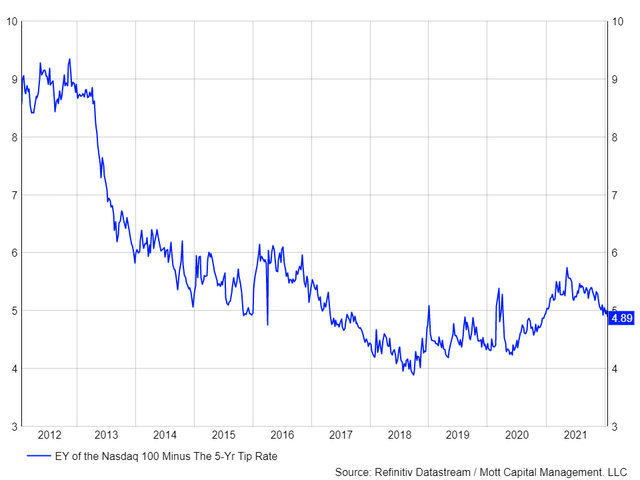
The ETF’s biggest problem is the underlying valuation of the index it tracks, which is currently at 26.2 times its next twelve months earnings estimates. That valuation has been lifted due to low-interest rates. Said another way, the earnings yields of the Nasdaq 100 is 3.82%, while the 5-Yr TIP rate is -1.1%. When adjusting for that low real yield, the real earnings yield for the Nasdaq 100 rises to 4.89%.
The problem is that real yields are rising as the Fed has threatened to raise interest rates, which means for the difference between the Nasdaq earnings yield and the 5-Yr TIP to remain at 4.89%, every time the 5-yr TIP rises, the earnings yield of the Nasdaq 100 needs to increase. I have noted a few times now that the 5-yr TIP is breaking out and could be on its way to -0.50 bps, a huge move higher. That would send the earnings yield on the Nasdaq 100 to 4.42%. That move higher in the earnings yield compresses the PE multiple, sending it from 26.2 to 22.6, 13.7% lower than its value today. That would equate to the QQQ ETF dropping to $312.
Datastream/Mott Capital
Gamma Weighs Short Term
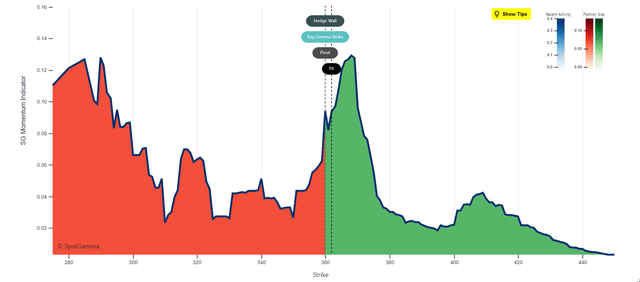
The options market shows that the QQQ ETF is very close to falling too much lower levels. According to data from SpotGamma, the gamma profile of the QQQ indicates that once the ETF breaks below $360, there’s not much gamma support in the market until the ETF drops to around $350. A lot of gamma will expire after the close on January 21, so that gamma profile can change slightly starting next week.
However, this suggests is that the selling is likely not over yet, with no significant support from an options perspective until the $350 area on the QQQ ETF.
SpotGamma
Technicals Breaking Down
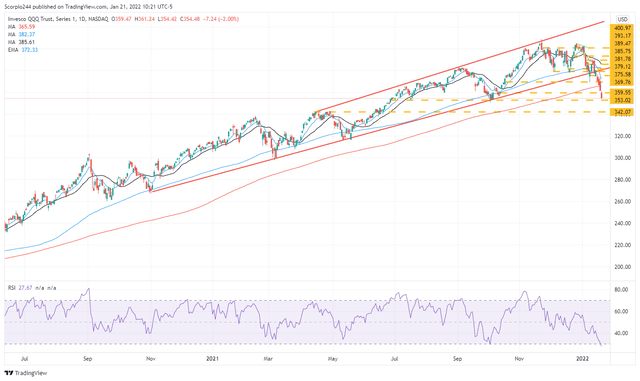
From a technical perspective, it looks pretty bad, with some support around the $353 region. After that, there’s no support again until the $342 area. This means the QQQ ETF continues to slide down a slippery slope. The only benefit is that the QQQ’s relative strength index is now trading 30 below, suggesting the ETF is oversold here. Should a rebound occur it is likely the QQQ ETF rises back to around $370, short-term, that is likely where the selling resumes.
TradingView
Amazon (AMZN)
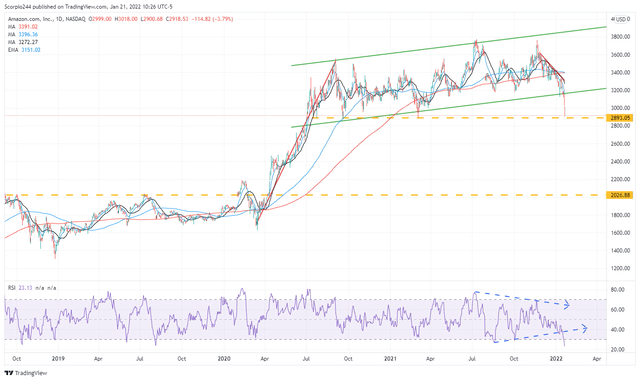
The other critical problem is that the technical charts for some of the most significant stocks in the QQQ ETF have started to break down too. Amazon, for example, has fallen below a critical uptrend. While some may have thought the stock was consolidating and getting ready for its next significant run higher, the technical pattern that formed was bearish. It looks a lot like a bull flag but has a subtle difference. The flag portion was sloping higher, a bullish flag pattern typically slopes lowers. Once Amazon breaks support around $2800, it could drop to around $2400.
TradingView
Nvidia (NVDA)
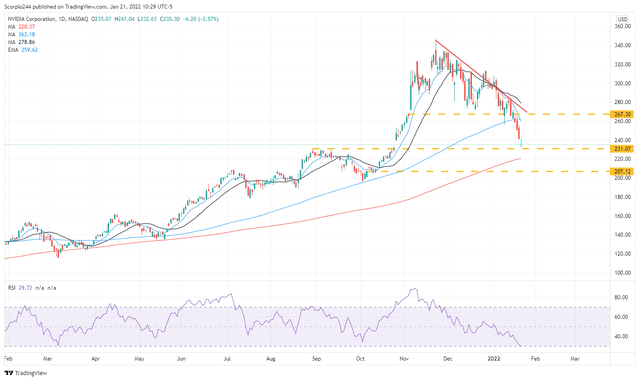
The same thing is happening with Nvidia, which has fallen below critical support around $267 and is now looking to fill a gap at $231. But once that level at $231 breaks, it could be on its way back to $208.
TradingView
Microsoft (MSFT)
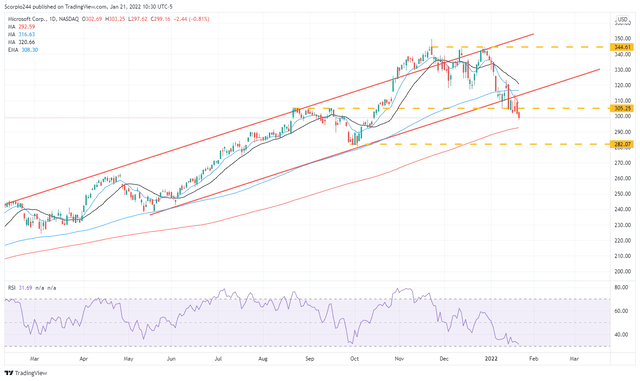
Microsoft has also fallen below critical support around $305; there is no further support for Microsoft until the $280 area.
TradingView
Looking For A Short-Lived Bounce
Again, the only positive thing here is that all of these stocks have RSIs that have hit or neared, hitting oversold levels around 30. It means they’re probably very close to finding a bounce. That’s not the same as saying they likely have found a bottom. What seems likely to happen for many of these stocks, including the QQQ, is to bounce hard and perhaps rise back to their higher support levels which have now become resistant. Once that happens, I would expect the selling to resume.
The higher real yields rise, the more selling will come to this market, especially the mega-cap growth stocks since these are the ones that have held up so well. That will drag the QQQ ETF lower.
[ad_2]
Source link Google News

