
[ad_1]
Here are the weekly charts for the gold, commodities and the dollar ETFs.
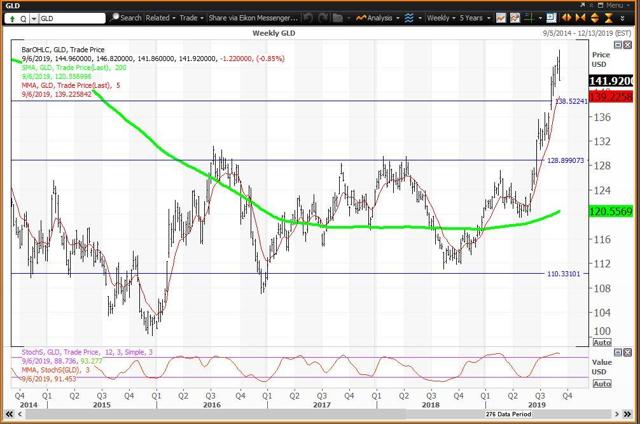
The gold trust ETF tracks the spot price of gold and is said to be backed by gold bars in vaults in London.
SPDR Gold Trust ETF (NYSEARCA:GLD)
 Courtesy of Refinitiv XENITH
The gold ETF ($141.92 on Sept. 6) is up 17% year to date and in bull market territory 27.8% above its Aug. 15, 2018 low of $111.06. The weekly chart remains positive but overbought with the ETF above its five-week modified moving average at $139.23 and above its 200-week simple moving average or “reversion to the mean” at $120.56. The 12x3x3 weekly slow stochastic reading slipped to 91.45 last week, down from 92.81 on Aug. 30. This reading above 90.00 last week made GLD in an “inflating parabolic bubble.” This week’s “key reversal” adds to the warning of a popping bubble.
Investor Strategy: Be patient and buy weakness to its semiannual value level at $128.85. My monthly pivot for September is $138.57. Last week’s high of $146.82 was just above last week’s risky level of $146.36. The Sept. 9, 2011 high remains at $185.85.
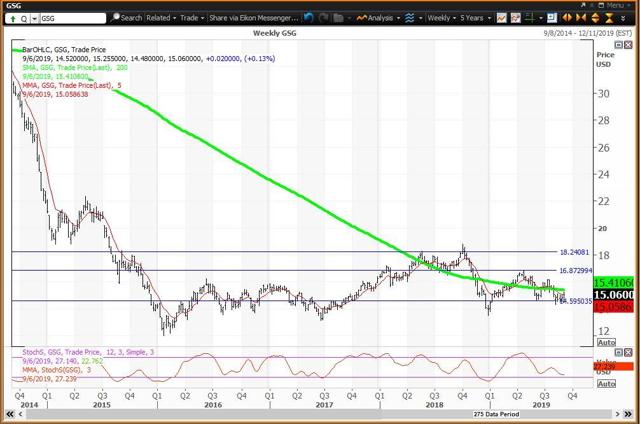
The commodity ETF is heavily weighted to energy by about 60%.
iShares S&P GSCI Commodity-Indexed Trust ETF (NYSEARCA:GSG)
 Courtesy of Refinitiv XENITH
The commodities ETF ($15.06 on Sept. 6) is up 7.4% year to date and up 11.6% since its Dec. 26 low of $13.50. This ETF is 19.9% below its Oct. 3, 2018 high of $18.81, so it’s rising above the bear market threshold of a 20% decline. The weekly chart will be upgraded to positive this week if the ETF closes above its five-week modified moving average at $15.06 and could rise above its 200-week simple moving average or “reversion to the mean” at $15.41. The 12x3x3 weekly slow stochastic reading slipped to 27.24 last week, down from 27.29 on Aug. 30 and will likely rise this week.
Investor Strategy: Buy weakness to the weekly value level at $14.61 and reduce holdings on strength to its monthly and quarterly risky levels at $16.99 and $18.23, respectively.
The weekly chart for Nymex crude oil ($56.52 on Aug. 30) has a positive weekly chart with oil below its five-week modified moving average at $55.81 and above its 200-week simple moving average or “reversion to the mean” at $53.33 which held last week as a buying opportunity. The 12x3x3 weekly stochastic reading rose to 40.94 last week, up from 39.00 on Aug. 30. It’s semiannual and annual value levels are $47.93 and $38.76, respectively, with monthly and quarterly risky levels at $68.34 and $75.38, respectively,
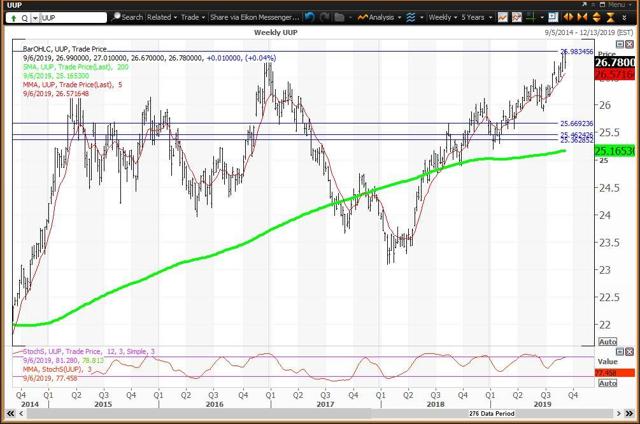
The US Dollar ETF is a basket of currencies that includes the Dollar vs. Euro, Japanese Yen, British Pound, Canadian Dollar, Swedish Krona and Swiss Franc.
Invesco DB USD Bullish ETF (NYSEARCA:UUP)
 Courtesy of Refinitiv XENITH
The dollar ETF ($26.78 on Sept. 6) is up 5.2% year to date and up 15.8% since trading as low as $23.12 in early-2018. A multiyear intraday high of $27.01 was set on Sept. 3 and was a test of this month’s risky level. The weekly chart remains positive with the ETF above its five-week modified average at $26.57 and above its 200-week simple moving average or “reversion to the mean” at $25.17. The 12x3x3 weekly slow stochastic reading rose to 77.47 last week, up from 75.55 on Aug. 30.
Investor Strategy: Buy weakness to its annual value level at $25.47 and to its 200-week SMA at $25.17. Investors reduced holdings on strength to its monthly risky level at $26.99 last week and that continues to be the strategy this week. Annual and semiannual pivots are $25.47 and $25.65, respectively.
How to use my value levels and risky levels:
Value levels and risky levels are based upon the last nine weekly, monthly, quarterly, semiannual and annual closes. The first set of levels was based upon the closes on Dec. 31. The original annual level remains in play.
The weekly level changes each week. The monthly level changes at the end of each month, the latest on Aug. 30. The quarterly level was changed at the end of June.
My theory is that nine years of volatility between closes are enough to assume that all possible bullish or bearish events for the stock are factored in.
To capture share price volatility, investors should buy on weakness to a value level and reduce holdings on strength to a risky level. A pivot is a value level or risky level that was violated within its time horizon. Pivots act as magnets that have a high probability of being tested again before its time horizon expires.
How to use 12x3x3 Weekly Slow Stochastic Readings:
My choice of using 12x3x3 weekly slow stochastic readings was based upon back-testing many methods of reading share-price momentum with the objective of finding the combination that resulted in the fewest false signals. I did this following the stock market crash of 1987, so I have been happy with the results for more than 30 years.
The stochastic reading covers the last 12 weeks of highs, lows and closes for the stock. There is a raw calculation of the differences between the highest high and lowest low versus the closes. These levels are modified to a fast reading and a slow reading and I found that the slow reading worked the best.
The stochastic reading scales between 00.00 and 100.00, with readings above 80.00 considered overbought and readings below 20.00 considered oversold. Recently, I noted that stocks tend to peak and decline 10% to 20% and more shortly after a reading rises above 90.00, so I call that an “inflating parabolic bubble” as a bubble always pops. I also call a reading below 10.00 as being “too cheap to ignore.”
Disclosure: I/we have no positions in any stocks mentioned, and no plans to initiate any positions within the next 72 hours. I wrote this article myself, and it expresses my own opinions. I am not receiving compensation for it (other than from Seeking Alpha). I have no business relationship with any company whose stock is mentioned in this article.
[ad_2]
Source link Google News