
[ad_1]
Here are the daily charts for the gold, commodities and the dollar ETFs.
The gold ETF tracks the spot price of gold and is said to be backed by gold bars in vaults in London.
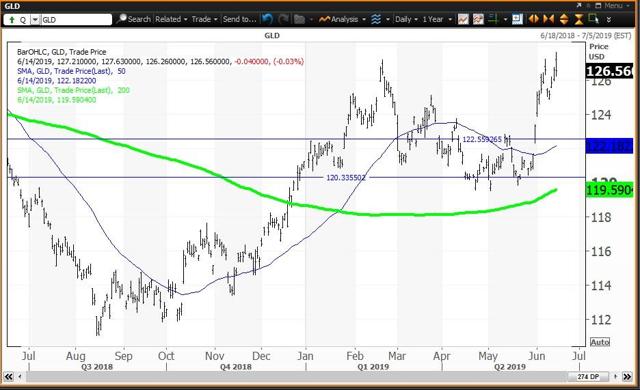
SPDR Gold Trust ETF (NYSEARCA:GLD)
 Courtesy of Refinitiv XENITH
The gold ETF ($126.56 on June 14) is up 4.4% year to date and is 14% above its Aug. 15 low of $111.06. GLD is well above its 50-day and 200-day simple moving averages at $122.18 and $119.59, respectively. The weekly chart is positive with the ETF above its five-week modified moving average at $123.51 and above its 200-week simple moving average or “reversion to the mean” at $118.86. The 12x3x3 weekly slow stochastic reading rose to 53.66 last week, up from 39.45 on June 7.
Investor Strategy: Buy weakness to the quarterly and semiannual value levels at $122.55 and $120.36, respectively, and reduce holdings on strength to its monthly risky level at $129.58.
The commodity ETF is heavily weighted to energy by about 60%.
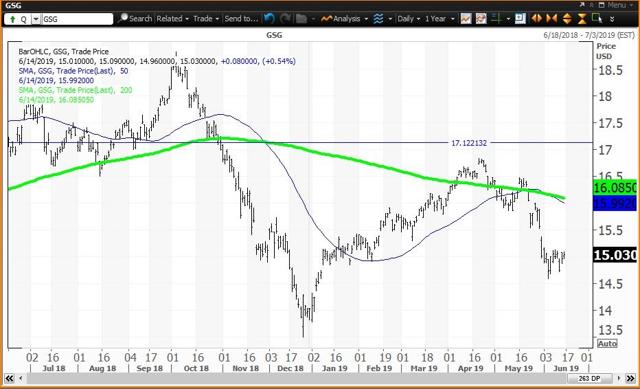
iShares S&P GSCI Commodity-Indexed Trust ETF (NYSEARCA:GSG)
 Courtesy of Refinitiv XENITH
The commodities ETF ($15.03 on June 14) is up 7.2% year to date and up 11.3% since its Dec. 26 low of $13.50, tracking the volatility in Nymex crude oil. This ETF is also in bear market territory, down 20.1% below its Oct. 3 high of $18.81. GSG is below its 50-day and 200-day simple moving averages converged at $15.99 and $16.09, respectively. The ETF is between its monthly value level at $12.87 and its quarterly risky level at $17.13. The weekly chart is negative with the ETF below its five-week modified moving average at $15.57 and below its 200-week simple moving average or “reversion to the mean” at $15.52. The 12x3x3 weekly slow stochastic reading fell to 32.79 last week, down from 42.21 on June 7.
Investor Strategy: Buy GSG on weakness to its monthly value level at $12.81 and reduce holdings on strength to its quarterly risky level at $17.13.
The weekly chart for Nymex crude oil ($52.51 on June 14) has a negative weekly chart with oil below its five-week modified moving average at $57.20 with its 200-week simple moving average or “reversion to the mean” at $52.66 acting as a magnet the last two weeks. The 12x3x3 weekly stochastic reading fell to 34.02 last week, down from 44.96 on June 7. Semiannual, annual and monthly value levels are $50.84, $38.76 and $38.54, respectively, with weekly and quarterly risky levels at $54.75 and $68.52, respectively. The semiannual level at $50.84 held at the lows the last two weeks.
The US dollar ETF is a basket of currencies that includes the Dollar vs. Euro, Japanese Yen, British Pound, Canadian Dollar, Swedish Krona and Swiss Franc.
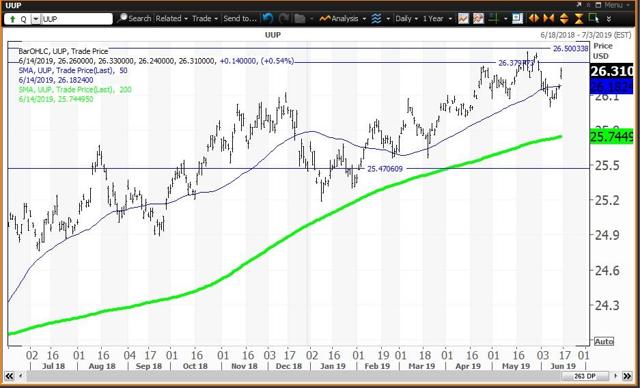
Invesco DB USD Bullish ETF (NYSEARCA:UUP)
 Courtesy of Refinitiv XENITH
The dollar ETF ($26.31 on June 14) is up 3.4% year to date and up 13.8% since trading as low as $23.12 in early 2018. UUP is above its 50-day and 200-day simple moving averages at $26.18 and $25.74, respectively. The weekly chart is neutral with the ETF above its five-week modified average at $26.18 and above its 200-week simple moving average or “reversion to the mean” at $25.08. The 12x3x3 weekly slow stochastic reading fell to 77.37, down from 80.43 on June 7. A close below $26.18 this week will downgrade the weekly chart to negative.
Investor Strategy: Buy weakness to annual and quarterly value levels at $25.47 and $23.89, respectively, and reduce holdings on strength to its semiannual and monthly risky levels at $26.39 and $26.53, respectively.
How to use my value levels and risky levels:
Value levels and risky levels are based upon the last nine weekly, monthly, quarterly, semiannual and annual closes. The first set of levels was based upon the closes on Dec. 31. The original semiannual and annual levels remain in play. The weekly level changes each week; the monthly level was changed at the end of January, February, March, April and May. The quarterly level was changed at the end of March. My theory is that nine years of volatility between closes are enough to assume that all possible bullish or bearish events for the stock are factored in. To capture share price volatility, investors should buy on weakness to a value level and reduce holdings on strength to a risky level. A pivot is a value level or risky level that was violated within its time horizon. Pivots act as magnets that have a high probability of being tested again before its time horizon expires.
The close on June 28 is the second most important for 2019. This close is an input to my proprietary analytics and will generate new weekly, monthly, quarterly and semiannual levels.
Disclosure: I/we have no positions in any stocks mentioned, and no plans to initiate any positions within the next 72 hours. I wrote this article myself, and it expresses my own opinions. I am not receiving compensation for it (other than from Seeking Alpha). I have no business relationship with any company whose stock is mentioned in this article.
[ad_2]
Source link Google News