[ad_1]
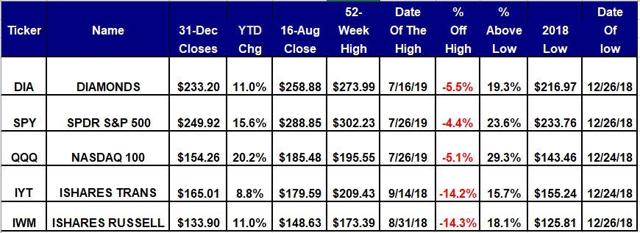
All five ETFs ended last week with negative weekly charts with their closes below their five-week modified moving averages and with their 12x3x3 weekly slow stochastic readings declining below the overbought threshold of 80.00 on a scale of 00.00 to 100.00.
Here’s Today’s Scorecard
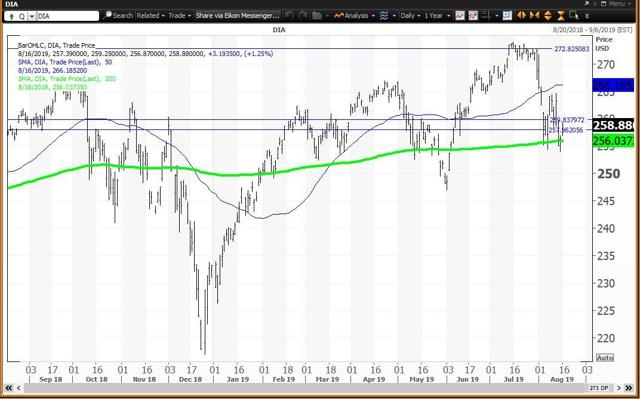
SPDR Dow Jones Industrial Average ETF (NYSEARCA:DIA)
 Courtesy of Refinitiv XENITH
The Diamonds ETF is 19.3% above its 2018 low of $216.97 set on Dec. 26 and set its all-time intraday high of $273.99 on July 16. Diamonds closed last week above its 200-day simple moving average at $256.04.
Diamonds has a negative weekly chart with the ETF below its five-week modified moving average at $264.72, with its 12x3x3 weekly slow stochastic reading slipping to 73.57 last week, down from 82.06 on Aug. 9. Monthly and annual pivots are $259.76 and $257.94, respectively, with its semiannual pivot at $272.78 and quarterly risky level at $285.35.
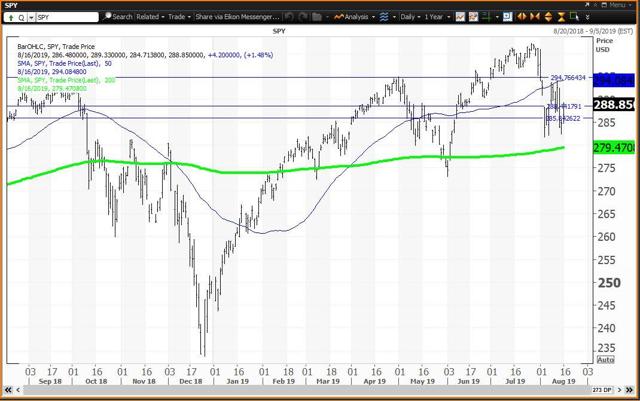
SPDR S&P 500 Trust ETF (NYSEARCA:SPY)
 Courtesy of Refinitiv XENITH
The Spiders ETF is 23.6% above its Dec. 26 low of $233.76 and set its all-time intraday high of $302.23 on July 26. Spiders is above its 200-day simple moving average at $279.47.
The weekly chart for Spiders is negative with the ETF below its five-week MMA at $292.99, with its 12x3x3 weekly slow stochastic reading slipping to 76.43 last week, down from 83.86 on Aug. 9. Monthly and annual pivots are $288.39 and $285.86, respectively, with a semiannual pivot at $294.72 and a quarterly risky level at $305.22.
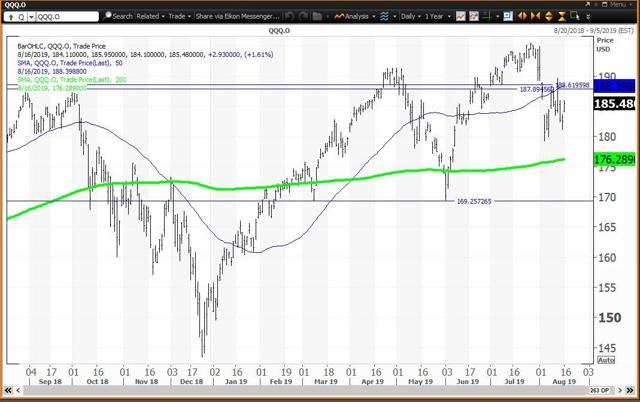
Invesco QQQ ETF (NASDAQ:QQQ)
 Courtesy of Refinitiv XENITH
The QQQ ETF is 29.3% above its 2018 low of $143.46 set on Dec. 24 and set its all-time intraday high of $195.55 on July 26. QQQ is above its 200-day simple moving average at $176.29.
The weekly chart for QQQ is negative with the ETF below its five-week MMA at $187.76, with its 12x3x3 weekly slow stochastic reading slipping to 77.65 last week, down from 83.81 on Oct. 9. The annual value level is $169.27 with monthly and semiannual pivots at $187.94 and $188.63, respectively, with its quarterly risky level at $201.51.
iShares Transportation Average ETF (NYSEARCA:IYT)
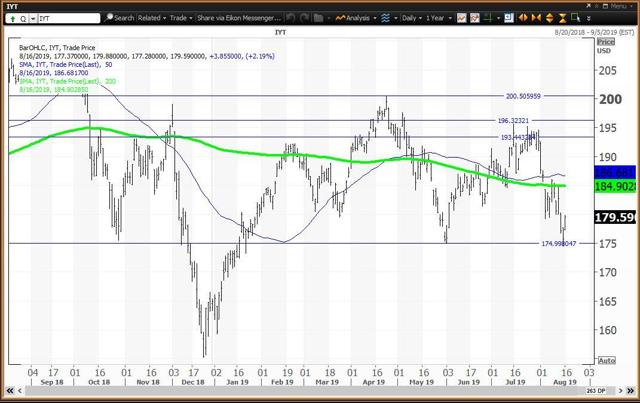 Courtesy of Refinitiv XENITH
IYT is 15.7% above its 2018 low of $155.24 set on Dec. 24. The ETF is in correction territory 14.2% below its all-time intraday high of $209.43 set on Sept. 14. The 2019 high of $200.42 was set on April 24. The ETF is below its 200-day simple moving average at $184.90.
The weekly chart for IYT is negative with the ETF below its five-week MMA at $186.23, with its 12x3x3 weekly slow stochastic reading slipping to 55.43 last week, down from 62.74 on Aug. 9. Its monthly value level is $174.93 with semiannual, annual and quarterly risky levels at $193.47, $196.35 and $200.49, respectively.
iShares Russell 2000 ETF (NYSEARCA:IWM)
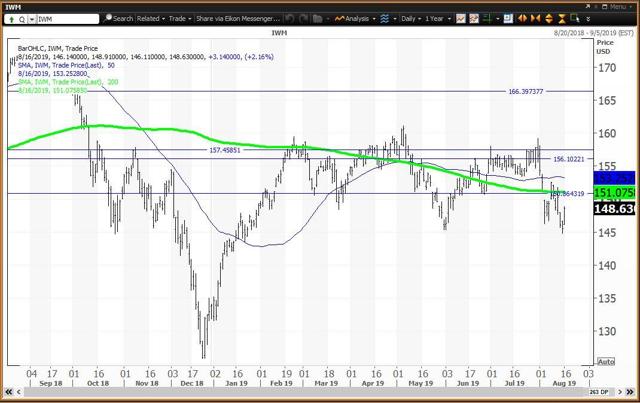 Courtesy of Refinitiv XENITH
IWM is 18.1% above its 2018 low of $125.81 set on Dec. 26 and is in correction territory 14.3% below its all-time intraday high of $173.39 set on Aug. 31. The 2019 high is $161.11 set on May 6. The Russell 2000 is below its 200-day simple moving average at $151.07.
IWM has a negative weekly chart with the ETF below its five-week MMA at $152.63. Its 12x3x3 weekly slow stochastic reading slipped to 52.34 last week, down from 59.02 on Aug. 9. A monthly pivot is $150.85 with semiannual and annual pivots at $156.14 and $157.49, respectively, and quarterly risky level at $166.36.
How to use my value levels and risky levels:
Value levels and risky levels are based upon the last nine weekly, monthly, quarterly, semiannual and annual closes. The first set of levels was based upon the closes on Dec. 31. The original annual level remains in play. The weekly level changes each week. The monthly level was changed at the end of each month, the latest on July 31. The quarterly level was changed at the end of June. My theory is that nine years of volatility between closes are enough to assume that all possible bullish or bearish events for the stock are factored in. To capture share price volatility, investors should buy on weakness to a value level and reduce holdings on strength to a risky level. A pivot is a value level or risky level that was violated within its time horizon. Pivots act as magnets that have a high probability of being tested again before its time horizon expires.
How to use 12x3x3 Weekly Slow Stochastic Readings:
My choice of using 12x3x3 weekly slow stochastic readings was based upon back-testing many methods of reading share-price momentum with the objective of finding the combination that resulted in the fewest false signals. I did this following the stock market crash of 1987, so I have been happy with the results for more than 30 years. The stochastic reading covers the last 12 weeks of highs, lows and closes for the stock. There is a raw calculation of the differences between the highest high and lowest low versus the closes. These levels are modified to a fast reading and a slow reading and I found that the slow reading worked the best. The stochastic reading scales between 00.00 and 100.00, with readings above 80.00 considered overbought and readings below 20.00 considered oversold. Recently, I noted that stocks tend to peak and decline 10% to 20% and more shortly after a reading rises above 90.00, so I call that an “inflating parabolic bubble” as a bubble always pops. I also call a reading below 10.00 as being “too cheap to ignore.”
Disclosure: I/we have no positions in any stocks mentioned, and no plans to initiate any positions within the next 72 hours. I wrote this article myself, and it expresses my own opinions. I am not receiving compensation for it (other than from Seeking Alpha). I have no business relationship with any company whose stock is mentioned in this article.
[ad_2]
Source link Google News