[ad_1]
PatrickZiegler/iStock via Getty Images
We are bullish on the NYSEARCA:SPY short term and bearish long term. On the charts below you can see the bullish, short term buy signals that are taking price higher during this technical bounce from oversold. You can also see our long term, bearish Sell signal for this bear market.
Because we are in a bear market, it will come as no surprise that every technical bounce will struggle to move higher as we are seeing with this technical bounce. When does the bounce end? When our signals turn down and you can see that has not happened yet.
What has happened so far? This technical bounce was off to a roaring start. As indicated in our article last week, we knew where the resistance levels were and where price would be smacked down. After all this is a bear market and not a bull market where nice things always happen.
Our short term signals are still bullish. We just issued an alert to our subscribers to be ready to buy below $410 if they wanted to continue trading this technical bounce to the upside. We expect support at $409 to hold and for this technical bounce to resume going back up to retest $416-417 resistance. We think the short term target is $420. If our Buy Signals don’t reverse, we are looking at $428.
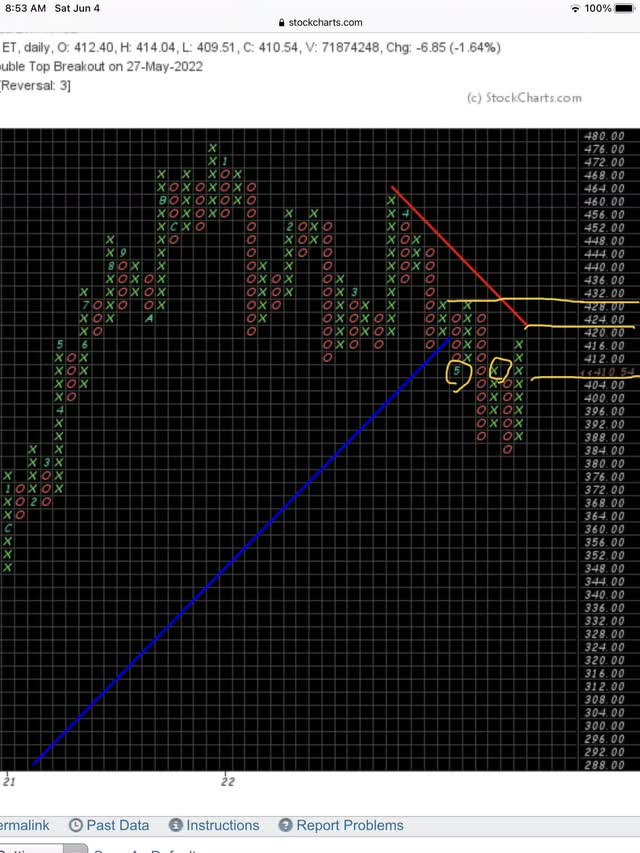
We like to use the older, Point & Figure chart because it is so clear at showing where buyers and sellers come in. We are looking for buyers to come in where they have in the past and we have circled where that has happened recently around $408.
Here is the Point & Figure chart to set the stage before we look at the more familiar weekly chart:
Bullish Bounce Short Term ( StockCharts.com)
So the above chart shows our near term target at ~$420 and short term support at ~$408. The actual closing price on Friday is shown and it blocks out the scale reading of $408. Price could go as low as $408, but we have to be ready to buy between $410 and $408 when we see the buyers coming in on the daily chart. The great advantage of this chart is that it eliminates all the daily emotional moves in the market, called “noise.”
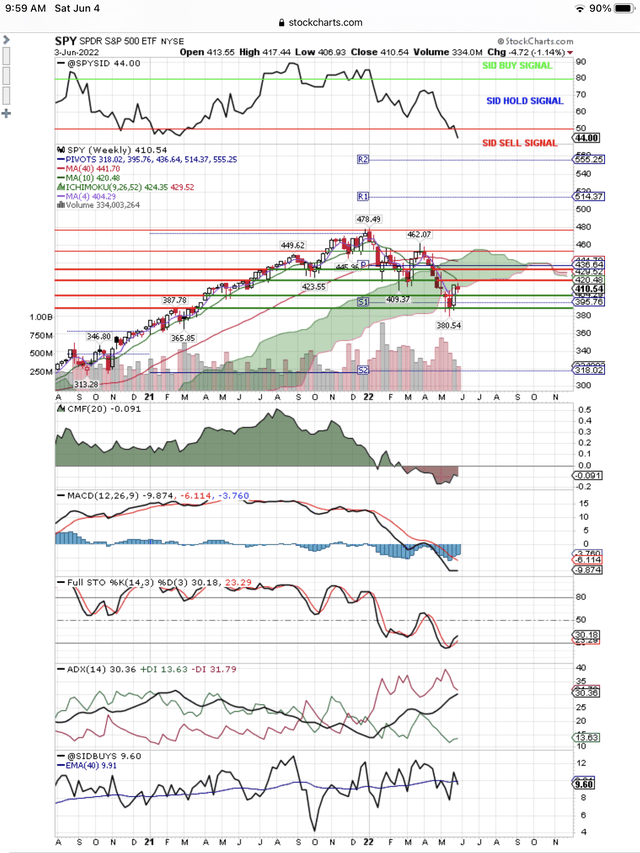
Now let’s turn to the weekly chart that is in the more familiar format. I have manually drawn the price support and resistance lines. We know from the above chart where the buyers and sellers come in and now we want to see it on the weekly chart.
At the top of the weekly chart shown below is our proprietary, long term signal for the SPY and you can see it is bearish. This signal uses both fundamentals and technicals. This tells us we are having a bullish bounce in a bear market.
As you can see, the other signals on this chart are still moving up, targeting higher prices for this technical bounce short term. When these signals turn down, we will turn bearish short term. Meanwhile, we are looking for this bounce to resume and take the SPY from $410 or lower, say $408, to $417 and $420. On some really good news, it might go to $428.
Here is our weekly chart:
Signals Improving For Bounce (StockCharts.com)
If you just look at price on the above chart, you can see the green support lines and the red resistance lines that I have drawn. During this bounce, I want to buy when price pulls back to support and sell when it hits resistance until the signals turn down. Right now you can see that the red in the CMF, Chaikin Money Flow, is improving. The bars on the MACD signal are improving. The Full Stochastic signal is turned up and improving. You can see the red line of Supply, on the ADX signal, dropping from an enormous, oversold peak. All these signals tell us the bounce is still in play.
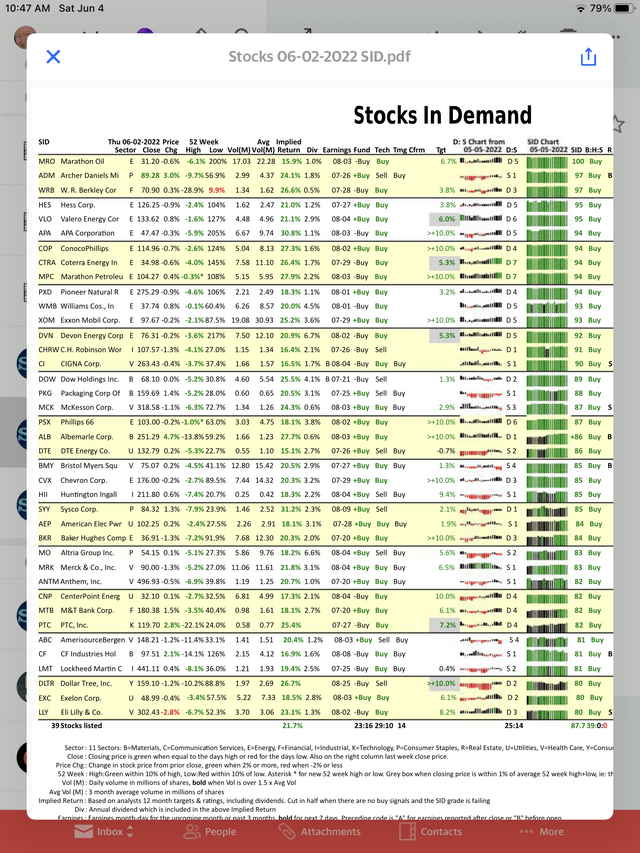
Notice at the bottom of the chart is our proprietary “SIDBUYS” signal telling us that 9.6% of the stocks in the Index have our Buy Signal. These stocks are helping the technical bounce we are seeing. Here is a partial list of stocks in the Index that have our proprietary SID Buy Signal:
Our Buy Signal Stocks In The Index (StocksInDemand.com)
Note that our proprietary, SID Buy Signals are shown in the far right columns of the above daily report sent to our subscribers.
[ad_2]
Source links Google News

