[ad_1]

MicroStockHub/iStock via Getty Images
Today, we will be deconstructing yet another exchange-traded fund that is supposed to mimic the performance of underappreciated, misunderstood, and consequently underpriced stock market bellwethers, the Invesco S&P 500 Enhanced Value ETF (SPVU).
Since its inception in October 2015, the fund has amassed only around $136.7 million in assets under management, which is almost 21x smaller than the portfolio of the Invesco S&P 500 Pure Value ETF (RPV) that I have reviewed earlier this month. Though due to sluggish AUM trends both have lackluster asset flows given their D+ and D grades, respectively, RPV has far stronger liquidity, with both 3-month and 6-month average daily dollar volumes being grossly above the asset class medians. Nevertheless, though lagging on volumes, SPVU offers a much more comfortable cost structure, with an expense ratio of just 13 bps vs. RPV’s 35 bps.
Investment strategy
Tracking the S&P 500 Enhanced Value index, SPVU mixes size and value factors. Somehow, it is also mindful of quality since loss-making companies cannot join the S&P 500 (IVV) (though they are certainly not immediately removed in case earnings turned negative).
The value score is somewhat minimalist since it aggregates just three metrics, namely Earnings/Price, Book Value/Price, and Sales/Price that are weighted equally. The one hundred of the S&P 500 constituents with the highest VSs are selected for the index, with weights depending on
the product of their market capitalization in the eligible index universe and the value score.
Sector weights are capped at 40%. At the moment, financials are SPVU’s largest allocation with ~40.3% of the net assets.
The methodology’s disadvantages I dislike here are similar to those highlighted in my notes on RPV and the iShares S&P 500 Value ETF (IVE). More specifically, I am skeptical of comparing the value scores in the whole selection pool not paying due attention to unquestionable sector differences. The P/B ratio, the inverted version of which is one of the ingredients added to the VS, is also a suboptimal metric in my view. And finally, I would like to see cash flows factored in the value rating for non-financial stocks.
Holdings
As of January 28, SPVU had a portfolio of 100 stocks. Its underlying index has been rebalanced recently, in December, with the next review due in June.
The key ten cohort have a weight of over 39%, with CVS Health (CVS) being the largest investment accounting for almost 5.7%.
The top-heaviness problem is one of the culprits of its subpar Risk profile, which is also marred by elevated standard deviation and tracking errors being almost twice as high as the class medians. By contrast, RPV, which has 122 holdings, has a far lighter top, though its Risk is also clearly not ideal.
As I said above, SPVU is enamored of the banks and insurance companies, with the financial sector overall accounting for over 40%. It is not a mere coincidence. As candidates face value test that measures their composite scores vs. the whole universe, and IT competes with energy, etc., the financial sector with its median GAAP P/E of 10.9x and P/B of 1.25x certainly has an edge. The ETF is also overweight in healthcare (17.8%) and consumer discretionary stocks (9.4%), while IVV’s top sector, IT, has a measly 2.4% allocation.
As usual, I have analyzed the fund’s holdings using the powerful Quant data downloaded from the Seeking Alpha screener. In short, the results are not as great as I initially anticipated, but generally fine.
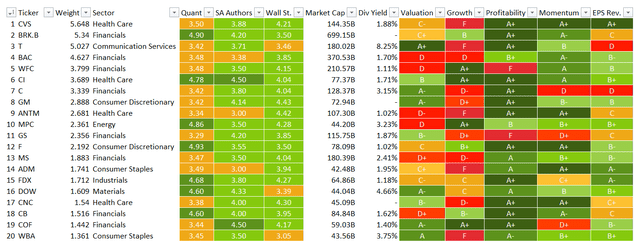
For better context, the table below compiles the key factors for the top 20 stocks (~57% weight).

Quant dashboard (Created by the author using data from Seeking Alpha and SPVU. Quant data as of Jan 31; the fund holdings as of Jan 28)
First, we see close to 49% of the net assets allocated to stocks with a Valuation grade of B- or better. That is not ideal, assuming that RPV had around 64% as of January 11. A clear disappointment is that 23% of the holdings have a D+ grade or worse, which means multiples of these players are dangerously overstretched. RPV had just ~6% allocated to such questionably valued companies.
However, it is worth noting that the valuation shakeup across the board has resulted in a few stocks losing their neutral or close to neutral valuation rating and moving to the overpriced club in the previous two weeks. For example, DuPont de Nemours (DD), a specialty chemicals industry heavyweight, has recently joined the club of the overappreciated.
As a consequence, we see that RPV’s share of richly priced stocks has risen to over 17% or 29 stocks vs. only 10 previously, while those with comfortable multiples now account for ~56%. All these are more likely the consequence of the evaporation of growth premia and slight compression of the sector medians.
A cheap valuation can be synonymous with poor quality, but in the upper echelon, it is rarely so. SPVU proved it once again. Just ~2.5% of its portfolio is allocated to mid-caps, so the risk of low-quality stocks percolating into the mix is fairly low. My analysis shows that over 90% of the portfolio have exemplary Profitability grades, with those in the A club, like Berkshire Hathaway (BRK.B) and General Motors (GM) accounting for 70%.
So for value investors who would never compromise on quality SPVU is yet another option to consider.
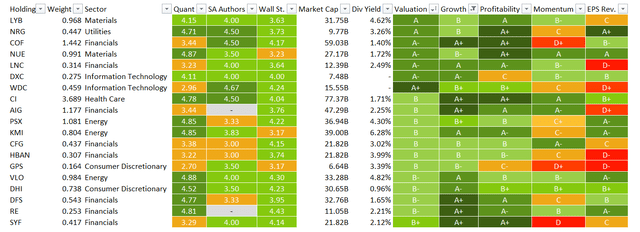
And finally, though unintentionally, the fund managed to add a few growth or, better to say, GARP, players. Over 34% have Growth grades equal to or above B-, while those boasting both growth and value characteristics (a GARP combination) have ~15.5% weight (see the table below).

Stocks exhibiting GARP characteristics (Created by the author using data from Seeking Alpha and SPVU. Quant data as of Jan 31; the fund holdings as of Jan 28)
Performance
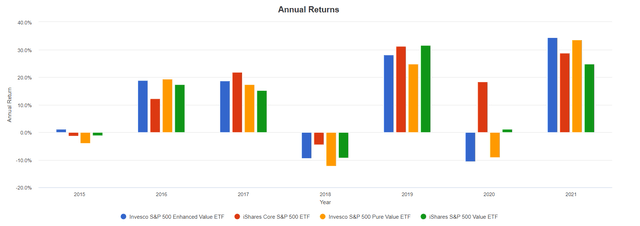
Since its inception, SPVU has outperformed IVV two times, in 2016 and 2021. 2021 was its strongest year, with the return even surpassing IVV’s by ~5.7%.

SPVU, RPV, IVE, IVV annual returns (Portfolio Visualizer)
From 31 October 2015 to 31 December 2021, SPVU delivered a compound annual growth rate above RPV’s, though all three value ETFs failed to beat the S&P 500.

SPVU, RPV, IVE, IVV CAGRs (Portfolio Visualizer)
IVE has a surprisingly stronger CAGR compared to its pure-value and enhanced-value peers. I believe the principal reason is that its returns were bolstered by growth players that qualified for inclusion in its benchmark that welcomes stocks exhibiting growth and value characteristics at the same time; meanwhile, RPV has far stricter rules, and overlap between RPV and the Invesco S&P 500 Pure Growth ETF (RPG) is impossible.
Final thoughts
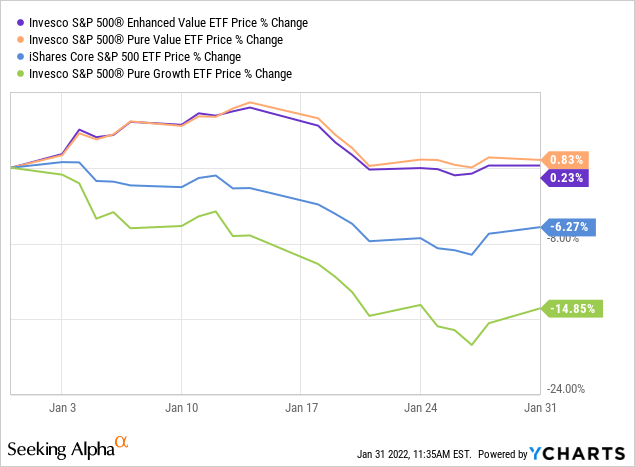
Interest rate expectations have stoked up the recent market correction, with growth stocks bearing the brunt, while value remained more or less strong.

Value investors cogitating on what ETF might be the best choice at the moment should first decide if they can tolerate even small holdings overlap with growth funds or not. RPV ignores companies demonstrating superior growth scores completely, while SPVU is a bit less picky given its ~3.3% overlap with RPG. The next question is how much financials is enough? Close to 32%? Or over 40%? And also, should a top-heavy fund be avoided given overreliance on just a handful of stocks? Liquidity and the size of a portfolio are also not to be overlooked. Please read the prospectus and do your own due diligence.
Regardless, I like SPVU’s equity mix, its hefty allocation to financials, and just 13 bps expense ratio. In 2022, it should do well.
[ad_2]
Source links Google News

