[ad_1]
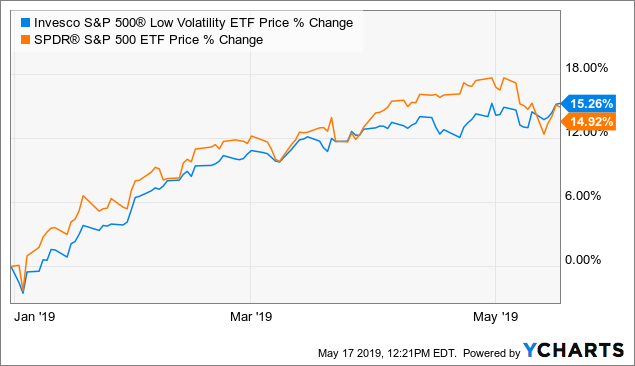
As I am setting up semi-annual reviews with clients to review performance and Investment Policy Statements, I find myself recommending the S&P 500 Low Volatility Index ETF (SPLV) more and more. With geopolitical risks appearing with Iran, and tariff risks with President Trump, the SPLV is acting as a way to manage risk while still earning solid returns. I am not one to ever go 100% in any one investment, where that mindset is not prudent for any individual or professional investor. However, it is really hard today to not consider the SPLV replacing the commonly held S&P 500 ETF (SPY) in one’s portfolio. Lets dig in below and look at a performance graph of SPLV vs. SPY year-to-date.
Year-To-Date Chart
 Data by YCharts
As you can see from the above chart, the SPLV is now outperforming the SPY. I expect this divergence in performance to widen as interest rates are declining from markets are becoming more sensitive to headline geopolitical risks. The SPLV is outperforming due to it owning interest rate sensitive sectors. Lets take a look at the one-year chart as well to see how the SPLV is actually stacking up.
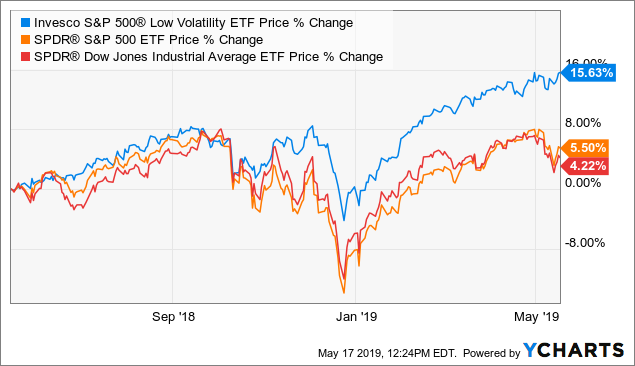
One-Year Chart
 Data by YCharts
When looking at the one-year chart, you can see that the SPLV out-performance of the S&P 500 is over 10%, and well over 11% for the Dow Jones Industrial (DIA). For anyone looking for funds that are outperforming common indices, this is one of them.
The SPLV Risk Metrics
When considering any new investment or replacement fund, it is pivotal that one looks at its risks metrics. This is where my finance nerd side comes out when looking at the beta and alpha stats of a fund vs. an appropriate benchmark or alternative investment.
| Metric | S&P 500 | SPLV |
|---|---|---|
| Arithmetic Mean (monthly) | 0.85% | 0.97% |
| Arithmetic Mean (annualized) | 10.66% | 12.30% |
| Geometric Mean (monthly) | 0.75% | 0.92% |
| Geometric Mean (annualized) | 9.44% | 11.56% |
| Volatility (monthly) | 4.43% | 3.43% |
| Volatility (annualized) | 15.36% | 11.86% |
| Downside Deviation (monthly) | 3.02% | 2.15% |
| Max. Drawdown | -13.52% | -6.79% |
| US Market Correlation | 1.00 | 0.90 |
| Beta(*) | 0.96 | 0.67 |
| Alpha (annualized) | 0.60% | 4.96% |
| R2 | 99.36% | 81.44% |
| Sharpe Ratio | 0.54 | 0.82 |
| Sortino Ratio | 0.77 | 1.27 |
| Treynor Ratio (%) | 8.57 | 14.45 |
| Active Return | 0.34% | 2.47% |
| Tracking Error | 1.36% | 7.28% |
| Information Ratio | 0.25 | 0.34 |
| Skewness | -0.82 | -0.75 |
| Excess Kurtosis | 0.48 | 0.66 |
| Historical Value-at-Risk (5%) | -8.79% | -6.79% |
| Analytical Value-at-Risk (5%) | -6.45% | -4.66% |
| Conditional Value-at-Risk (5%) | N/A | N/A |
| Upside Capture Ratio (%) | 100.08 | 78.59 |
| Downside Capture Ratio (%) | 98.44 | 60.30 |
| Safe Withdrawal Rate | 93.66% | 97.95% |
| Perpetual Withdrawal Rate | 8.57% | 10.89% |
| Positive Periods | 12 out of 16 (75.00%) | 11 out of 16 (68.75%) |
| Gain/Loss Ratio | 0.54 | 0.93 |
Source: PortfolioVisualizer.com
When looking at the risk metrics, most will get that deer in the headlight look. This is completely normal, as I do as well. Lets take a look at a few metrics that will do a great job of summarizing why SPLV is outperforming SPY in more then just returns. The first measurement we will look at is the max drawdown. This ratio calculates what the worst potential loss is in any specific time period. For this measurement, we are looking at 2018-present. Right now, the max loss you would have faced is -6.79% vs. -13.52% for the SPY. This is super impressive in that SPLV dropped less than 50% of what the overall markets did this past year. Looking at the annualized volatility of the fund, SPLV comes in at around 12% per year, and the SPY is at 15.36%. The SPLV is doing exactly what it states in its prospectus by offering shareholders lower volatility vs. the S&P 500.
One last metric we will look at is the Sortino ratio. This ratio takes a look at the downside standard deviation risk of an investment only. Because the Sortino ratio focuses only on the negative deviation of a portfolio’s returns from the mean, it is thought to give a better view of a portfolio’s risk-adjusted performance. The SPLV is showing a reading of 1.27 vs. a .77 SPY reading. You want to see a higher reading like this when comparing a fund to its benchmark or competitor fund. A rational investor wants the fund with the higher Sortino ratio because it means that the investment is earning more return per share than that of the negative risk it takes on.
Summary
When looking at the SPLV’s performance numbers, one can see that the 10% alpha it has produced over a year is nothing to slouch over. What sticks out to me is the impressive risk metrics across the board. I always want to see a fund or investment produce such alpha, which SPLV is doing consistently. The funds near-term outlook is very positive. As the fund owns the 100 lowest names at all times, it is strategically invested right now to benefit from the lower interest rates. Utilities, real estate and financials are all benefiting from lower rates, which is the funds biggest sector holdings. If you are looking for a superior risk-adjusted return to replace your SPY, consider the Invesco S&P 500 Low Volatility ETF today.
Disclosure: I am/we are long SPLV. I wrote this article myself, and it expresses my own opinions. I am not receiving compensation for it (other than from Seeking Alpha). I have no business relationship with any company whose stock is mentioned in this article.
Additional disclosure: Ortner Capital consults clients who own SPLV. These opinions are that of Josh Ortner, CTFA. Please consult your own certified professional on your specific risks, objectives, and time horizons.
[ad_2]
Source link Google News

