
[ad_1]

Epiximages
Investment thesis and background
Recent market corrections opened up interesting possibilities for dividend growth investors. Especially for high-quality dividend growth stocks, they have spent years in an overvalued regime during the long bull run. And recent corrections have brought their valuations to a more reasonable level.
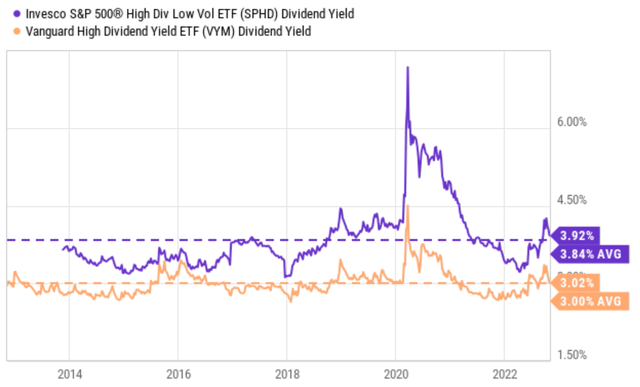
Take the stocks in the Invesco S&P 500 High Dividend Low Volatility Portfolio ETF (NYSEARCA:SPHD) and also the Vanguard High Dividend Yield ETF (NYSEARCA:VYM) as an example. As a group, the holdings in SPHD now offer a dividend yield of 3.92%, slightly above its historical average of 3.84%, indicating a slight undervaluation (by about 2% in relative terms). And for the stocks in VYM, as a group, they now offer a dividend yield of 3.02%, again slightly above its historical average of 3.00% and indicating a slight undervaluation. And later you will see that in terms of P/E multiples, both funds are trading at 12.7x P/E, a quite reasonable level both in relative terms and also absolute terms.
Intrigued by their fair valuation, the remainder of the article takes a deep dive into both funds. And you will see the reasons that make us like VYM better: lower fee, higher return performance, and also lower volatility than SPHD (despite SPHD’s goal of minimizing volatility).
Source: Seeking Alpha
SPHD and VYM: Basic info
Both SPHD and VYM (especially VYM) are popular exchange-traded funds (“ETFs”) among dividend growth investors. Both funds seek high dividend yield, although they have their differences as detailed in the fund description below (slightly edited and the emphases added by me):
VYM fund description: VYM seeks to track the performance of the FTSE High Dividend Yield Index, which measures the investment return of common stocks of companies characterized by high dividend yields. It provides a convenient way to track the performance of stocks that are forecasted to have above-average dividend yields.
SPHD fund description: SPHD is based on the S&P 500 Low Volatility High Dividend Index. The Fund will invest at least 90% of its total assets in common stocks that comprise the Index, which is composed of 50 securities traded on the S&P 500 Index that historically have provided high dividend yields and low volatility.
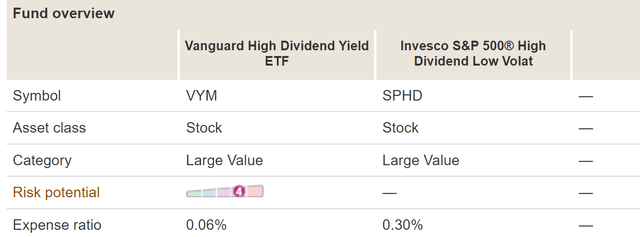
As seen, VYM seeks stocks with above-average yield in the large-cap space, while SPHD adds a further twist of using lower volatility as a criterion for its picks too. Due to their similar strategy, both funds offer comparable P/E multiples of 12.7x, as you can see from the second chart below.
Although note that there are a few differences. SPHD is a much more concentrated fund with only 50 equity holdings, compared to the 443 holdings in VYM. In terms of market cap, the average SPHD holdings (with a median market cap of $30.6B) are also substantially smaller than those in VYM (with a median market cap of $120.6B). Finally, SPHD charges a higher fee of 0.3%, compared to the 0.06% charged by VYM. Do not overlook the seemingly small difference in the fees. You will see that the difference is larger than what’s on the surface once we contextualize it later.
Source: Vanguard.com
Source: Vanguard.com
SPHD vs. VYM: Past performance
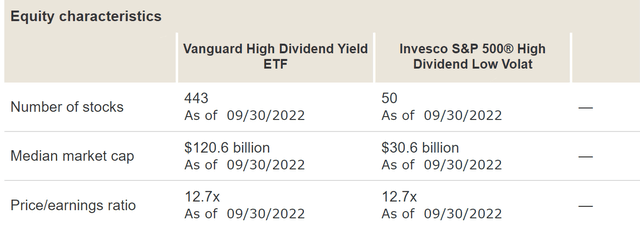
The next chart compares the past performance of SPHD and VYM. Since SPHD was relatively young (launched within the past 10 years), so the comparison is only made on a one-year, three-year, and five-year basis.
As you can see, the VYM fund has been lagging SPHD in the past 1-year by a small marge of 1.2% (-5.28% vs -4.08%). However, over a longer period, the VYM fund has been leading the SPHD fund by a wider margin both on a five-year and three-year basis. To wit, on a five-year basis and based on market prices, VYM returned 6.54% CAGR, which is almost 2x higher than SPHD’s 3.32% CAGR over the same period. And the contrast on a 3-year basis is even more dramatic, with VYM returning 5.58% CAGR compared to 1.45% from SPHD.
Next, you will see why my view is that VYM’s past outperformance is likely to continue in the future, too.
Source: data from Vanguard.com
VYM vs. SPHD: A closer look at their holdings
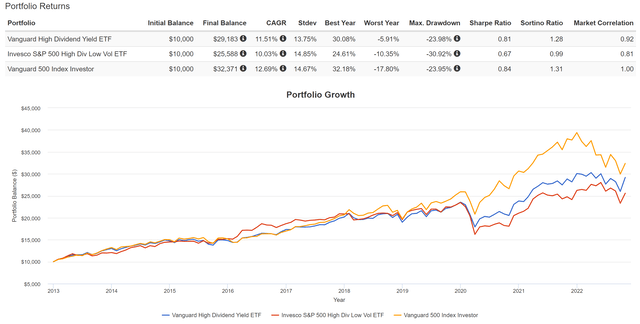
The next chart compares their performance since SPHD’s inception in 2013, benchmarked by the S&P 500. As seen, since 2013, SPHD delivered a 10.03% annual return, quite healthy. But when compared to over 11.5% from VYM and 12.7% from the S&P 500, the lag is quite large. And later you will see that SPHD has a higher turnover rate than both VYM and S&P 500, which makes its lag even larger when after-tax returns are considered.
Next, as you can also see from the chart, SPHD does not actually achieve its goal of minimizing volatility either. The fund actually experienced higher volatility risks than both the market as a whole and VYM. Relative to both VYM and the entire market (especially VYM), it has had a higher standard deviation (14.85% vs 13.75% from VYM), a worse worst-year performance (-10.3% vs 15.9% from VYM), and a significantly greater maximum drawdown (-30.9% vs -23.9% from VYM).
Source: Portfolio Visualizer
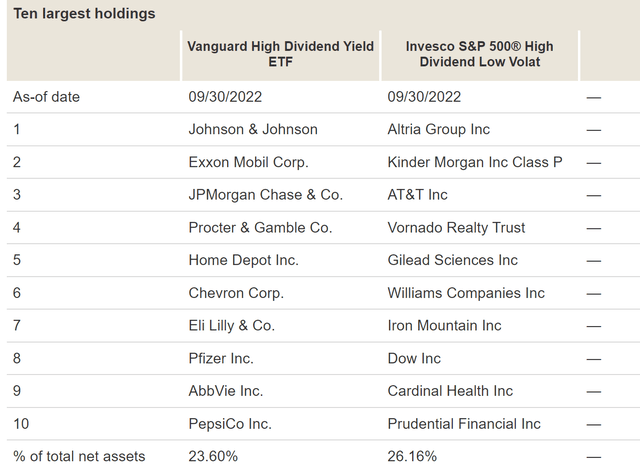
The way I see things, such lower performance and higher volatility risks are built into SPHD’s indexing method, which is backward-oriented. As aforementioned, the fund consists of 50 stocks that have HISTORICALLY demonstrated low volatility – and the operative word here is “historically.” The chart below compares SPHD’s top 10 picks to those in VYM, and the backward-oriented method simply jumps out at me. It may be true that stocks like (MO), (KMI), (T), et al have shown lower volatility in the past, but the likelihood for them to maintain low volatility given their current conditions is far lower than stocks like (JNJ), (XOM), and (JPM).
Given such contrast in the scale, profitability, and financial strength in their holdings, as mentioned above, my view is that VYM’s past outperformance – both in terms of performance and safety – is very likely to continue in the future, too.
Source: Vanguard.com
Other risks and conclusions
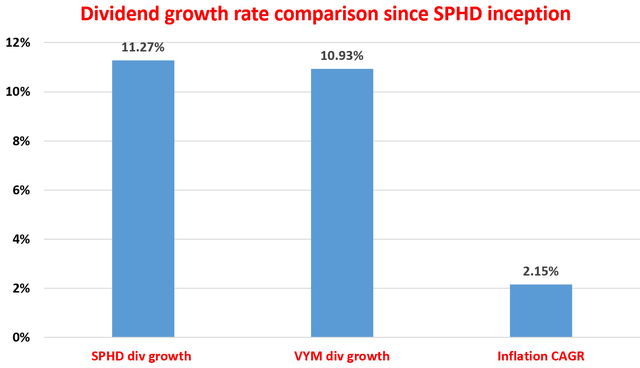
After pointing out all the negatives in SPHD, let me also point out some of its positives (i.e., its upside risks). First, SPHD provides a much higher dividend yield than VYM. Its current yield of 3.92% is almost 30% higher than VYM’s 3.02% in relative terms, definitely a strong draw for investors who need current income. Secondly, historically, SPHD has been growing its dividend slightly faster than VYM too. As shown in the chart below, its dividend payouts have grown at an impressive rate of 11.27% CAGR since its inception, faster than VYM’s 10.93% during the same period and also substantially above the average inflation during the same period too.
Source: author based on data from Seeking Alpha.
To conclude, both VYM and SPHD are about fairly valued thanks to the corrections both in terms of P/E multiples (both 12.7x) and dividend yields (both within 2% of their long-term historical average). However, after a closer look, I have to conclude that I prefer VYM better. SPHD’s past returns do not compare favorably against VYM and it actually suffered higher volatility risks. And my view is that past performance would continue into the future too given the fundamental indexing methods used in SPHD. I feel more comfortable with the scale, profit-generating ability, and balance sheet strength for the holdings in VYM.
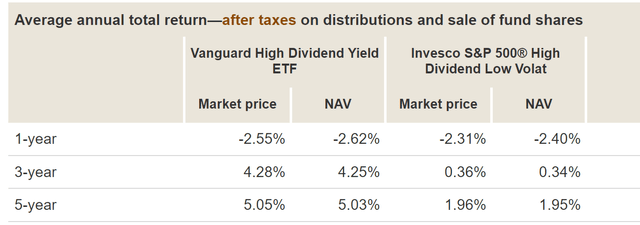
Let me wrap up by closing a loop that I opened earlier regarding the fees and also after-tax returns. If you recall from an earlier chart, on a 5-year and pretax basis, VYM returned 6.54% CAGR, which is almost 2x higher than SPHD’s 3.32%. And the contrast on a 3-year basis is even more dramatic, with VYM returning 5.58% vs. 1.45% from SPHD. The bad news for SPHD is that the picture is even uglier when taxes are considered due to its higher turnover rates. As seen in the chart below, on a 5-year and after-tax basis, VYM returned 5.05% (compared to 6.54% pretax), while SPHD returned 1.96% (compared to 3.32% pretax). On a 3-year basis, VYM returned 4.28% (compared to 5.58% pretax), while SPHD returned 0.36% (compared to 1.45% pretax). These numbers also put the difference in their fees into perspective. The 0.24% difference in their fees (0.3% vs. 0.06%) is a pretty large portion of the after-tax return potential for both funds.
Source: Vanguard.com
[ad_2]
Source links Google News