[ad_1]
Vertigo3d/E+ via Getty Images
Investment Thesis
The SPDR S&P Transportation ETF (XTN) is a 50-stock equal-weight fund with tremendous potential, but it also carries immense risk. Volatile airline stocks now make up 30% of the ETF, while safer stocks in the Trucking, Air Freight & Logistics, Marine, and Railroad industries account for the difference. My view is that while companies like C.H. Robinson Worldwide (CHRW) and FedEx (FDX) will outperform, XTN will suffer from poor relative performances in stocks like Delta Air Lines (DAL) and Wheels Up Experience (UP), a newcomer to the ETF. While I acknowledge the possibility of being wrong and that airline stocks could soon soar, I think the number of possible outcomes is so huge that I’m unwilling to recommend taking the risk. Avoid XTN for now, but keep it on your watch list should we get a sign that airlines are on their way again to profitability.
ETF Overview
Strategy & Performance
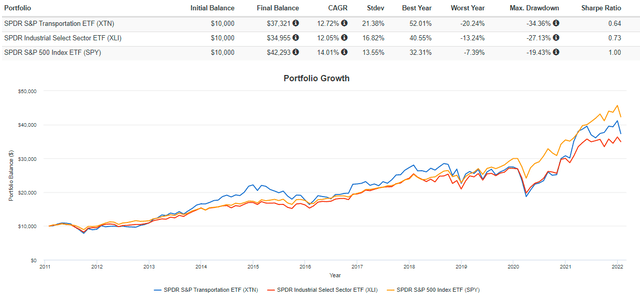
XTN passively tracks the S&P Transportation Select Industry Index, which has outpaced the SPDR Industrial Select Sector ETF (XLI) by 0.67% per year since its inception 11 years ago, but underperformed the SPDR S&P 500 Index ETF (NYSEARCA:SPY) by 1.29% per year.
Portfolio Visualizer
Importantly, XTN is a much more volatile ETF, evidenced by its 21.38% annualized standard deviation and 34.36% maximum drawdown figure, which occurred from September 2018 to March 2020. For me, this highlights how crucial it is to pick your entry and exit points carefully rather than use XTN as a “set-it-and-forget-it” investment. Before I review XTN’s composition and fundamentals, here is a summary of some of the fund’s basics for quick reference.
- Current Price: $83.21
- Assets Under Management: $795 million
- Expense Ratio: 0.35%
- Launch Date: January 26, 2011
- Trailing Dividend Yield: 1.14%
- Five-Year Beta: 1.45
- Number of Securities: 50
- Portfolio Turnover: 26.00%
- Assets in Top Ten: 23.88%
- 30-Day Median Bid-Ask Spread: 0.11%
- Premium To NAV: 0.03%
- Tracked Index: S&P Transportation Select Industry Index
Industry Exposures & Top Holdings
The U.S. transportation segment includes exposure to just five industries, as follows:
- Trucking (34.65%)
- Airlines (30.35%)
- Air Freight & Logistics (19.19%)
- Marine (9.13%)
- Railroads (6.68%)
I initiated coverage of XTN back in June 2021, and at the time, the composition was significantly different. In particular, XTN only had a 24.03% exposure to Airlines, with the offset coming primarily in Air Freight & Logistics, which had a 24.69% allocation. It also held just 41 stocks at the time and has since added five airlines with a combined weight of 8.02%. These include Wheels Up Experience, Sun Country Airlines (SNCY), Joby Aviation (JOBY), Blade Air Mobility (BLDE), and Frontier Group Holdings (ULCC). In my view, these small-cap additions decrease the quality of the fund. Joby Aviation, for example, is currently trading nearly 40% off its 50-day moving average price.
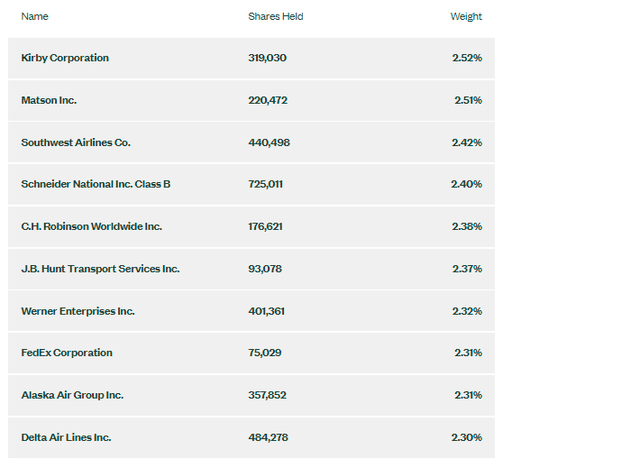
State Street lists the top ten holdings below, which total 24%. XTN rebalances each quarter, so I anticipate these to revert to an equal weight in March. At present, Kirby Corporation (KEX) and Matson (MATX), two Marine transportation stocks, have the highest weighting because of their strong year-to-date performances.
XTN Fund Overview
Airline Troubles
Stock Snapshot
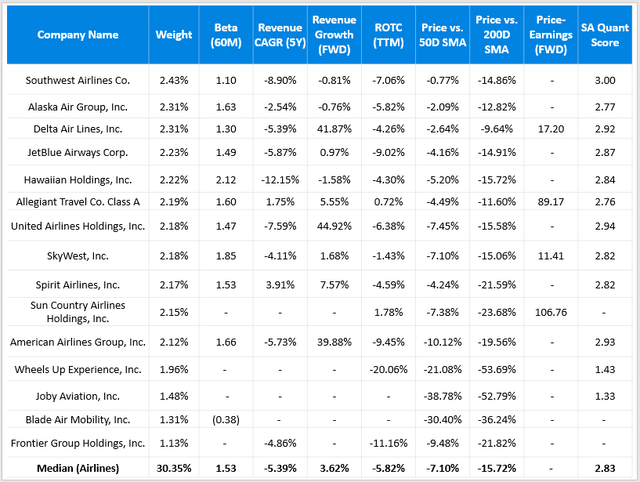
XTN’s 15 airline stocks are struggling, all trading below their 50-day, 100-day, and 200-day moving average prices. Here is a summary of some selected fundamental and technical metrics:
Created By Author Using Data From Seeking Alpha
In addition to airline stocks’ poor momentum, they’ve also been downright unpredictable as they fight to regain profitability status. Revenues for most are still down compared to five years ago, as is their return on total capital. Seeking Alpha has given this group a bearish 2.83 Quant Score, which is significant considering their nearly one-third allocation in the fund.
The details also reveal how challenging it is to measure an ETF’s price-earnings ratio. According to XTN’s Fact Sheet, XTN appears very well priced at just 12.88x forward earnings. However, their calculation uses the harmonic weighted average, which will always result in a lower figure than a simple weighted-average method, and they also include all outliers.
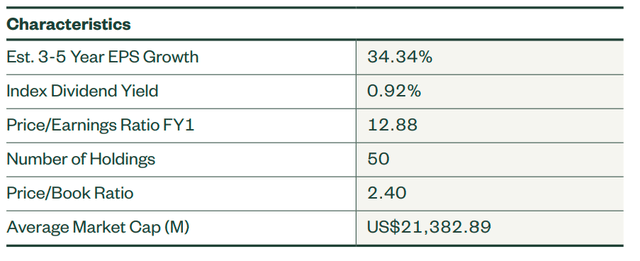
XTN Fact Sheet
But the bottom line is that analysts are expecting negative earnings for 11 of 15 airline stocks, plus four others in the Trucking industry. I see XTN as highly speculative right now. TSA Checkpoint numbers confirm this, as shown in the graph I compiled below, including the performance of the U.S. Global Jets ETF (JETS) since January 2019.
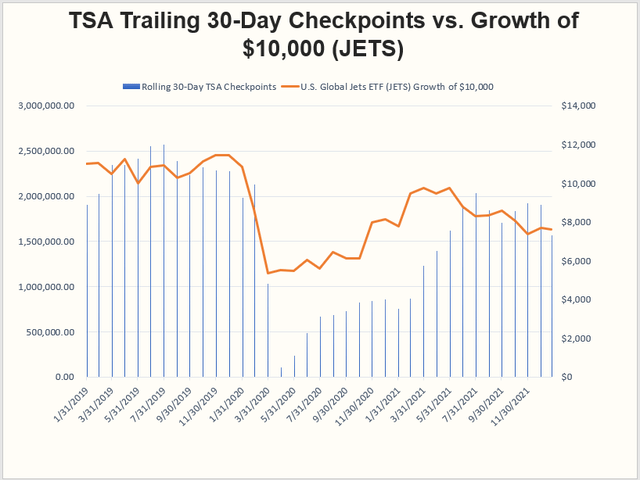
Chart Created By Author
TSA Checkpoint Travel Numbers and Portfolio Visualizer
Notice how the first significant drop in TSA checkpoints in Q1 2020 coincided well with a fall in returns for airline stocks. Since then, forecasting when airlines will recover has been challenging. Despite TSA checkpoint numbers remaining below one million until March 2021, JETS nearly managed to climb back to break-even status. What followed was a 22% decline even as checkpoint numbers grew to the 30-day 1.57 million rolling average we have now.
When Will Airlines Recover?
Since expectations, rather than current information, are driving airlines’ returns, I thought it would be helpful to explain what those expectations are. Bain & Company recently published their baseline, accelerated recovery, and drifting timelines relative to their pre-crisis forecasts and Indexed to 2019 levels. As shown, the baseline projection is that global commercial airline demand will only reach 97% of 2019 levels by the end of 2023. The baseline forecast for the end of 2022 is only 85% of 2019 levels, and even the best-case scenario is just 90% of 2019 levels. Indeed, it won’t be as quick of a recovery as many expect.
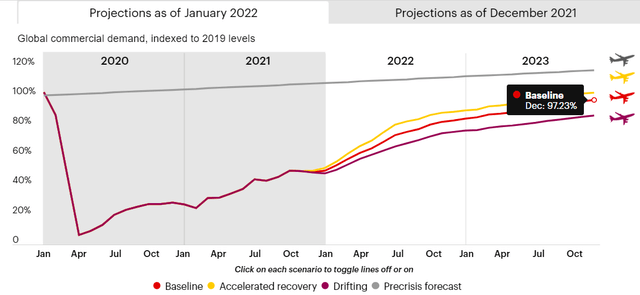
Bain & Company
Other Headwinds
While other factors could slow demand, like the constant threat of new variants, airlines themselves have other issues that will impact how well they perform long term. For instance, labor shortages, which extend not only to pilots but to other lower-paying jobs, will make flight cancellations more common. Over the Christmas holidays, airlines canceled hundreds of flights due to Omicron and ended up offering crews extra pay to pick up the slack. JetBlue offered flight attendants $1,000 for no call-outs through early January, and other airlines provided similar incentives.
Then there’s the issue of talent retention. Airlines need to thread the needle of offering sufficient executive compensation despite not being profitable. Otherwise, one can’t blame executives for transferring to more lucrative industries, especially in the latter stages of their careers. At-risk pay will need to be based more on non-profitability metrics. Still, even the biggest companies like Delta Air Lines struggle with this, partly due to restrictions on compensation as part of receiving government stimulus. Per its latest proxy statement:
Our leadership team has shown exceptional performance in managing the company in the face of the unprecedented challenges resulting from the pandemic. Notwithstanding these significant accomplishments, due to the impact of the pandemic on our business and our focus on compensation that is both performance-based and employee-aligned, the following actions were taken with respect to 2020 executive compensation:
› Reduced base salaries of our officers from April 1 through December 31, 2020
› Eliminated annual incentive plan payouts despite attainment of certain performance measures under the plan because no payouts were made to our frontline employees under the company’s broad-based employee profit sharing program (Profit Sharing Program)
› Did not alter the performance measures or goals for outstanding long-term incentive awards
As much as these pay restrictions make sense, it’s harmful to the industry. The projections made by Bain & Company suggest a difficult few years ahead, so I think airlines will need to look into altering their long-term incentive plans to attract and retain key employees. Simply put, it’s not the best industry to work in right now, and that could transfer over to investing as well.
Finally, there is a possibility of the “fully vaccinated” definition changing in 2022. According to the CDC, being fully vaccinated means the person has received their primary series of COVID-19 vaccines, while “up to date” includes any boosters as a person becomes eligible. I expect the latter definition to eventually become the CDC’s guidance sometime this year, especially since a December 2021 study published in Cell concludes that two doses fail to neutralize the Omicron variant. While requirements vary at the local level, it likely will hurt travel demand, and since expectations are everything in the industry right now, look for stocks to continue to struggle.
Investment Recommendation
XTN has outperformed the broader Industrials sector over the last decade, but it has done so with much more volatility. I expect this volatility to increase now that airlines make up nearly one-third of the ETF, and after analyzing the challenges the industry faces in 2022 and beyond, I find it too risky to bet on now. Threats of new variants will persist, and the industry has longer-term challenges attracting and retaining key talent, especially if profitability remains the critical factor driving executive compensation. If forecasts by Bain and Company are any guide, airlines will have several difficult years before returning to pre-crisis demand levels.
I also want to point out that XTN includes both strong and weak stocks in equal weight because of its methodology. Sometimes this is a positive feature, but twelve-month earnings per share are estimated to be negative for 15 out of 50 stocks. Most of these have a bearish Seeking Alpha Quant Score, too. It’s diversification for diversification’s sake, and for these reasons, I suggest avoiding XTN and waiting for profitability levels to improve before taking a position.
[ad_2]
Source links Google News

