[ad_1]

yusnizam/iStock via Getty Images
Thesis and background
Now is a challenging time for investors. Stock valuation is at a record high, bond yields are at a record low, and several crucial macroeconomic uncertainties are unfolding. As mentioned in our newly launched market service, we feel urged to remind investors that at times like this, it is especially important to stay disciplined and stay with simple and proven methods that you truly understand.
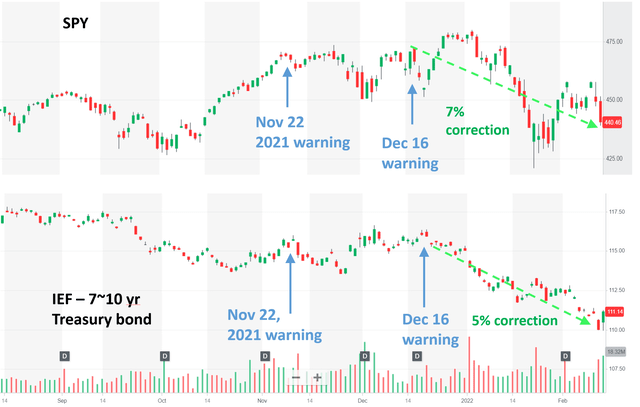
And a key to stay disciplined is to ALWAYS delineate short-term survival/withdrawal from long-term growth. Sadly, we’ve seen too many people around us make the tragic wrong moves, especially at our current extreme market junctures. Now specific to the SPDR S&P 500 Trust ETF (SPY) and its role in our survival/withdrawal portfolio, we ourselves have been seeing and publishing warning signs since last November. For example:
- In our Nov 22, 2021 article, we cautioned readers that our model showed a record low exposure index (“EI”), a key signal our proprietary algorithm monitors – a key parameter we use to allocate our cash reserve in all our accounts. We mentioned that now was a good time to increase cash reserve and be in a hunker-down mode with the summation SPY yield and treasury rate at a historical low.
- In our Dec 16, 2021 article, we cautioned again it was a good time to move toward maximum cash reserve and be in a hunker-down mode because of the warning signal from our exposure index again.
Those were clear signals for us. And we sold some equity and bond to increase our cash allocation. Shortly after this allocation change, both the stock and bond market went through a sizable correction as you can see next. As of this writing, SPY fell by about 7% (and the NASDAQ index fell more if you hold those funds). At the same time, the 10-year Treasury bond fell by more than 5%.
Looking forward, we see now is a good time to deploy some of the cash we reserved (and hopefully you did too) when both the equity and bond market peaked. More specifically, the remainder of this article will show:
- how you can use SPY’s yield information in combination with treasury yield to generate an effective exposure index (“EI”) to dynamically allocate cash
- how this simple, yet timeless, EI concept can help you generate extra alpha and safeguard your financial security in the long run.
- and how we use SPY ourselves guided by a few other equally simple and timeless concepts
Source: author and Yahoo finance
The exposure index (“EI”) and dynamic cash allocation
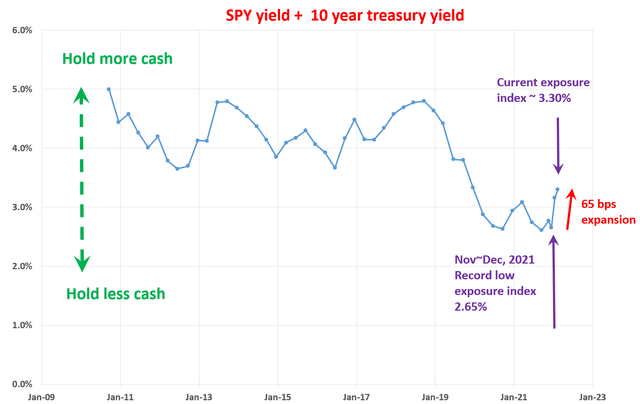
The underlying idea here is quite simple and intuitive. The summation of stock yield and bond yield provides a measure of the opportunity cost of holding cash. If the summation is high, it means the opportunity cost of holding cash is high. Because I could earn a high yield if the cash is invested either from bond or stock. And I will hold less cash in this case. Vice versa, if the summation is low, it means the opportunity cost of holding cash is low. I have no good place to invest the cash because bond yield and stock market yield are low.
With this overall concept, you can see that the summation has been in the range between about 2.5% and 5% in the past decade. The 5% summation level was reached 3 times, all during times when either stock, or bond, or both are in attractive valuation. And these are the times that I would be willing to take more risks and significantly reduce my cash position to invest in the stock, bond, or both. On the other hand, when the summation becomes lower, I will begin to increase my cash holding. And when it is low enough (like it is now), I will keep increasing my cash position until I reach a ceiling around or even above the 6 months of living expenses as aforementioned. Under this context, you can clearly see the warning signs I pointed out during Nov and Dec of 2021.
Lastly, note that the EI that we actually use is a bit more complicated than this (although the data in the chart illustrates the essence of the idea). In practice, the dividend yield from the stock market does not always reflect business fundamentals and can be distorted by things like:
- tax law – dividend can change quite a bit depending on whether the tax codes favor it or not.
- political climate – dividend can also change based on how politically popular it is.
- composition of the market index – dividend yield of “the market” can also be biased if the index is dominated by a few mega-caps who do not pay dividends – like what we are experiencing now.
Thus we have to develop a proprietary algorithm to adjust for these factors and correct the distortion. But again, the simple summation of yields provides a good approximation already and illustrates the essence of the EI idea.
Author
How did we use the EI idea and how did it perform?
In short, we did what we wrote (and we always do).
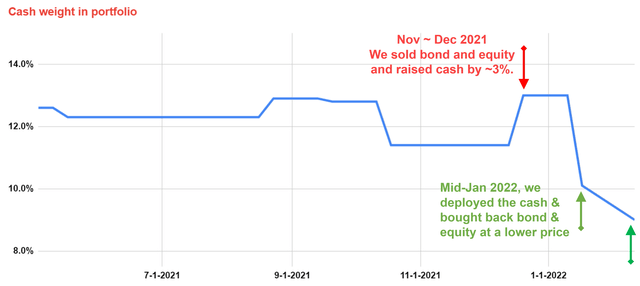
Since the opportunity cost of holding has become so low during Nov to Dec 2021 (again because the EI was near record low during that time), we sold both bonds and equity in our accounts during our Nov and Dec 2021 account maintenance and raised our cash holding by ~3% to 13%. And our maximum cash allocation is designed following this guideline: the cash holding is such that the cash, when combined with the intermediate bonds and the dividends generated by this portfolio, should be able to cover about 6 months of our living expenses.
Then during our mid-Jan 2022 maintenance, we deployed the cash and bought back the bond and equity at a lower price.
A cash allocation near 13% is close to our maximum allocation under this guideline, and we felt no fear at all for missing out should the bond and/stock make a new high – our motto is that we only need to become rich once in this lifetime. We really urge our readers to be more on the cautious side under these market conditions and do not pursue growth UNLESS/UNTIL you have put aside enough funds in your survival portfolio.
I do not rebalance my portfolio that often to minimize turnover and efforts (and tax consequences for my taxable accounts). I rebalance my portfolio monthly in the middle of every month. Also, I only rebalance when the change is large enough – i.e., the change in the yield spread needs beyond some threshold to trigger a rebalance. So that is the reason why you do not see that many changes (or large changes) historically, but you see:
- The relatively large rebalance during Dec to increase cash reserve due to the red flag in the EI.
- Also, the relatively large deployment during our mid-Jan 2022 account maintenance to buy back the bond and equity at a lower price. Because the EI is much less favorable for holding onto cash (and much more favorable for holding equities and bonds) now as aforementioned.
- Looking forward, we plan to further decrease cash holding in our upcoming mid-Fed account maintenance (assuming no dramatic rally of bond and/or equity price in the next 3 days)
Author
How did the method perform?
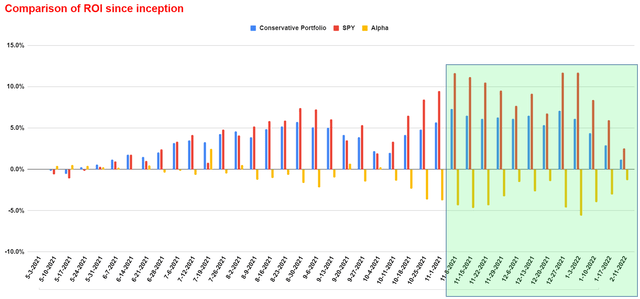
The next few charts show the actual results of our survival/withdrawal account since we first wrote about it on SA back in May 2021, and also the backtest results over a longer period of time (we have finalized the model and started executing it ourselves since about 2010). The backtest runs back to 1994 because that’s when SPY was launched. A couple of key takeaways:
- Its performance lags the overall market in general with no surprise in the long run (for one thing – due to the cash holding).
- But it fluctuates a lot less and does a much better job preserving capital. As one example, in the short period since Nov 2021, it caught with the overall market almost entirely as highlighted in the green box in the first chart.
- As highlighted by the blue boxes in the third chart, its standard deviation is about half of that of the overall market, its worst year performance is about 1/3 of the overall market, and finally, the maximum drawdown is about half of the overall market.
- The preservation capabilities are even more impressive when we look at the historical drawdowns during all the market crises as shown in the last chart. In the past three decades or so since 1994, there have been 4 major market crises. As highlighted in the orange box, the overall US markets suffered drawdowns of 50%, 44%, 15%, and 5% respectively. In contrast, the conservative portfolio only suffered one double-digit drawdown of 26%. And all the other drawdowns are in the single-digit range, from ~2% to 8%.
- Finally, going back to the first bullet point, the comparison of performance can be very misleading if you actively withdraw. The magic of compounding is such that a 10% loss hurts you more than a 10% gain can help you – it’s a simple mathematical fact. So a withdrawal when your portfolio is underwater hurts you much worse than taking/spending a profit (it feels like you are spending the house money even though it is not). As a result, if you actively withdraw, the REAL performance of this method is actually a LOT better than these charts show.
Author
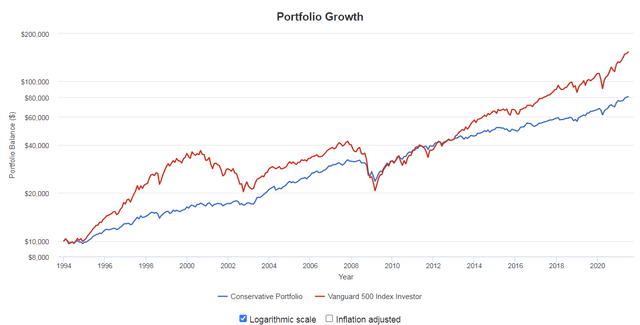
Source: Author, with simulator from Portfolio Visualizer, Silicon Cloud Technologies LLC

Source: Author, with simulator from Portfolio Visualizer, Silicon Cloud Technologies LLC

Source: Author, with simulator from Portfolio Visualizer, Silicon Cloud Technologies LLC
Conclusions and final thoughts
The SPY fund is a cornerstone for many investors like ourselves. With the fund’s valuation near a history peak, not only its own history but the entire history of the stock market, we feel urged to remind ourselves and other investors that:
- The first secret of building long-term wealth is simplicity. Especially during extreme times like this, it is especially important to stay with simple and timeless methods that you truly understand – because you CAN NOT stick to it unless you understand it.
- ALWAYS delineate short-term withdrawal needs and long-term growth needs by building two separate portfolios. Use a conservative portfolio, with sufficient cash, to ensure short-term survival.
- If you are in the withdrawal stage, use a simple guideline to guide your short-term survival needs. Something like our exposure index or the 6-month living expense reserve we use – but it can be something else that suits your situation better. The key is to keep it simple and understandable. And do NOT be discouraged by the performance drag due to cash holding and do not be misguided by the fear of missing out. The magic with compounding is that a 10% loss hurts you much more than a 10% gain can help you. When you have to liquidate your asset at fire-sale prices to meet short-term needs, your long-term survival is in danger.
- Dynamically adjust the cash reserve when there is – and when there is – a loud and clear market signal to generate extra returns like those we saw in Nov and Dec 2021. The EI has expanded significantly since then it has become less favorable for holding onto cash we also plan to further decrease our cash holding and buy back SPY (and some bonds too) in our upcoming account maintenance.
[ad_2]
Source links Google News

