[ad_1]
menonsstocks/E+ via Getty Images
Introduction to SMIN
iShares MSCI India Small-Cap ETF (BATS:SMIN) is an exchange-traded fund offering exposure to small public companies listed/based in India. SMIN is basically an Indian small-cap fund, created by iShares (part of BlackRock). The fund invests in accordance with its chosen benchmark index, the MSCI India Small Cap Index.
The fund had 321 holdings as of January 20, 2022, with assets under management of $409 million. At less than half a billion AUM, SMIN is a relatively small ETF. The expense ratio is 0.74%, which is high, and reflects the focus of the strategy and probably also the lesser popularity.
Recent SMIN Fund Flows
Over the past twelve months, SMIN fund flows have been positive on a net basis.
ETFDB.com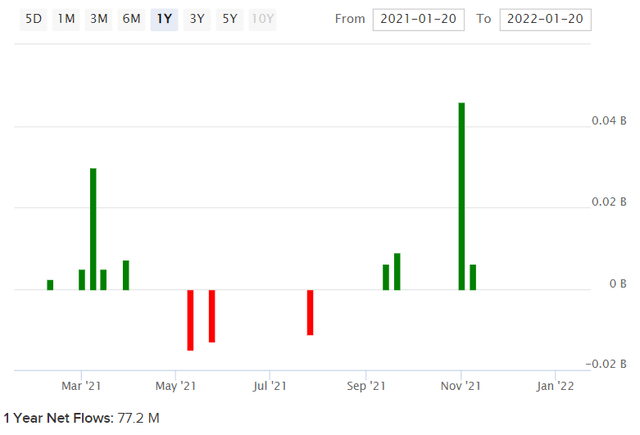
With about $77 million in net fund flows, SMIN has enjoyed a relatively strong boost, especially in early November, relative to prevailing AUM. Generally speaking, as India is an “emerging market”, and as small caps are generally viewed as riskier (hence the idea of a “small cap [risk] premium”; small-cap stocks are often assumed to offer higher potential returns in exchange for greater risk), SMIN should be viewed as a risky instrument. Inflows into SMIN should therefore pick up as (especially U.S.) investors seek higher returns.
Since inception, SMIN has actually under-performed SPDR S&P 500 ETF Trust (SPY), a popular U.S. ETF designed to track the performance of the popular U.S. equity benchmark index, the S&P 500. The chart below illustrates the under-performance (about -27% on a price-only basis since inception). Dividends do not make up the difference (You are lucky to see a SMIN dividend yield of more than 2%.)
TradingView.com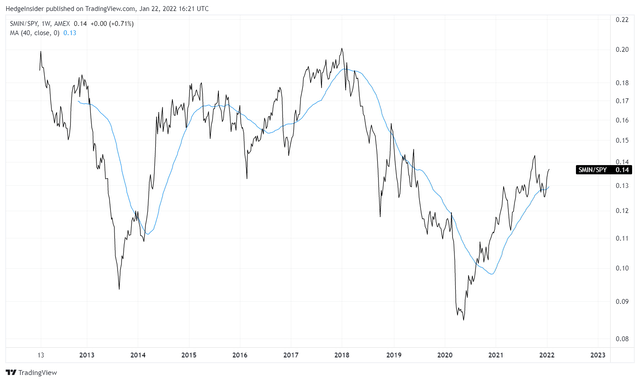
Nevertheless, the chart above also shows that SMIN has been appreciating more than SPY since the March 2020 global equity market lows (post COVID-19 emergence). The delta is just over +60% since those lows on a closing basis. Also, SMIN clearly shows an ability to out-perform over certain periods of time, if not since inception. The time from August 2013 to January 2018 is one long period, where the out-performance was over +100% on a price basis.
So, it is possible that SMIN continue to out-perform, although this is likely to require a strong international macroeconomic environment, and a strong global business environment. The Indian rupee (national currency) is also relevant, although the Reserve Bank of India (the country’s central bank) does intervene to manage the currency’s value.
SMIN FX Risk
The chart below illustrates the appreciation of the U.S. dollar against INR over several decades. Clearly the rupee has struggled to hold up against the U.S. dollar, although USD/INR has remained fairly steady since around 2014. An annual appreciation rate (of the USD/INR exchange rate, i.e., an annual depreciation rate of the rupee vs. the U.S. dollar) of circa 2% is a little concerning, but not too alarming.
TradingView.com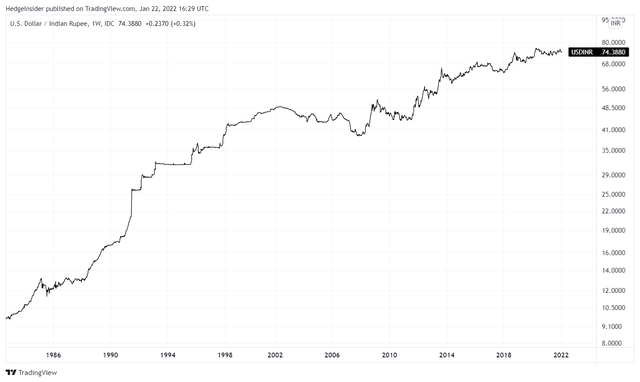
The Economist’s Big Mac Index offers a PPP (Purchasing Power Parity) fair value estimate as of July 2021 on a GDP-per-capita adjusted basis, suggesting the rupee is in fact undervalued with over 22% upside potential. On the other hand, the Indian current account is still negative, suggesting some further rupee weakness should not be ruled out:
TradingEconomics.com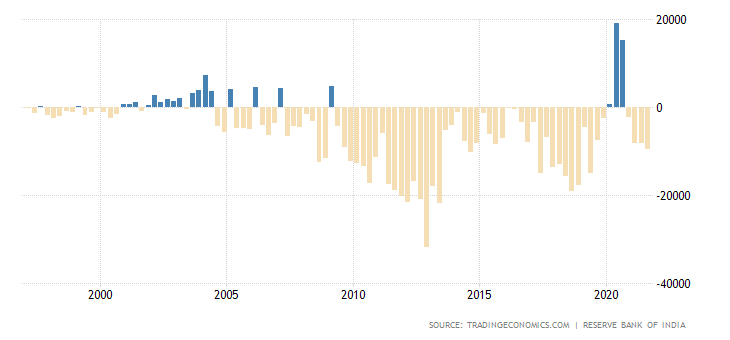
Nevertheless, the current account deficit is about in line with history (since at least 2005), so once again, an annual level of rupee depreciation of about 2% is probably likely. A weaker rupee would, all else equal, make SMIN’s holdings less valuable in U.S. dollars. But a persistently weaker rupee can also help to support long-term export performance, and thus local aggregate demand and corporate earnings. So long as FX volatility is not very high, I would see the FX risk component here as mostly self-correcting and self-balancing.
Sector and Business Cycle Positioning
We know that SMIN is exposed to small caps. In terms of sectors, the greatest exposures lie in Materials (19% as of January 20, 2022), Industrials (18%), Financials (15%), Consumer Discretionary (14%), and Information Technology (9%). This makes the fund economically sensitive, which ties back to my previous point; to do well, SMIN needs a buoyant economic environment.
iShares.com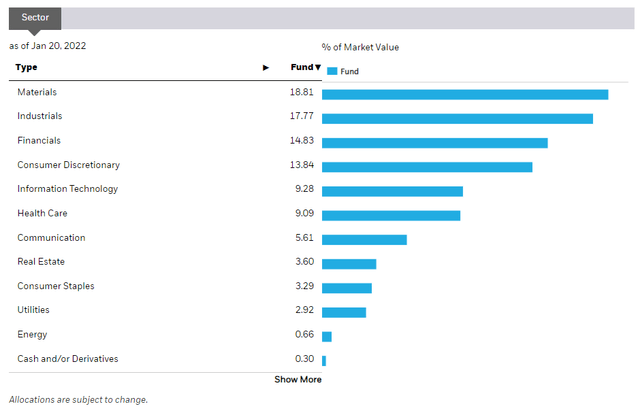
For Q4 2021, Fidelity suggest that India is probably still in its recovery stage of its present business cycle, based on factors such as GDP growth, credit growth, profit growth, government policy, and inventory/sales growth.
Fidelity.com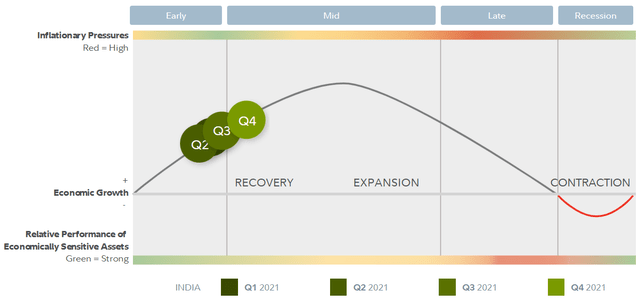
GDP at constant prices has not retaken its prior highs, but India seems to be on the right trajectory (post the COVID-19-related plunge in 2020).
TradingEconomics.com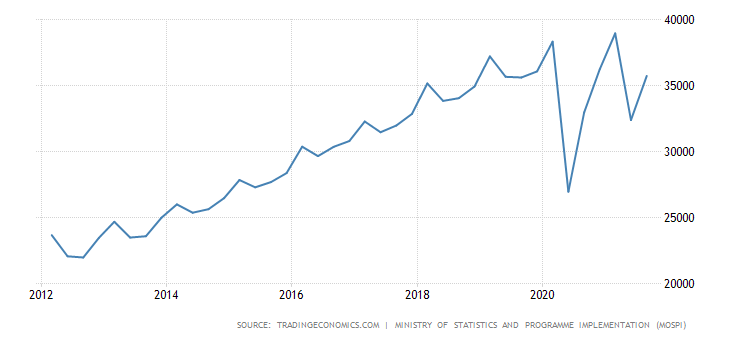
SMIN’s sector exposures, which are economically sensitive (as economies expand, higher long-term rates often arise which can support the profit margins of Financial stocks, while Materials stocks can benefit from increased investment and exports, and Consumer/Tech from increased consumer and business spending). Therefore, SMIN looks fairly well positioned from this perspective. This could also help to support recent positive SMIN fund flows.
Portfolio Concentration and Volatility
With well over 300 holdings, SMIN is not as concentrated as one might assume for a small-cap emerging market fund. Based on data from iShares, I have calculated the top 10 holdings (pictured below) as representing roughly 12% of SMIN’s portfolio as of recent.
Data from iShares.com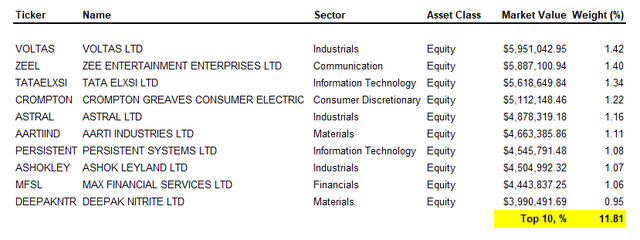
This is a relatively low level of concentration, so SMIN can be fairly viewed as a diversified macro-oriented bet on small Indian businesses (that is, listed ones).
In terms of volatility, we can look to “beta”, a measure of relative volatility. Yahoo Finance! and ETF.com offer estimates of 1.10x and 0.94x, respectively. In other words, SMIN is not notably volatile, although the fund did fall (peak-to-trough) more than U.S. equity ETFs like SPY into March 2020 (by about 10% more than SPY, when SPY fell by about a third itself). So, you have to assume that SMIN could see higher relative drawdowns in particular situations, owing to its nature as a small-cap ETF focused on an emerging market.
Key SMIN Portfolio Data
SMIN’s benchmark index’s factsheet as of December 31, 2021, reports a trailing price/earnings ratio of 37.92x, a forward price/earnings ratio of 23.22x, a price/book ratio of 3.58x.
Two important observations here would be that the forward implied earnings yield is 4.3% as of the same date, and the underlying forward return on equity is 15.4%. The former is quite tight for a riskier emerging market, while the forward ROE is decent but not especially strong. Still, given the level of diversification, the ROE is quite good, and suggests reasonably high corporate productivity and the potential for long-term price appreciation.
Based on Morningstar data, analysts are anticipating three- to five-year average earnings growth rates for SMIN’s portfolio of circa 18.74% per year. This is high, but Indian inflation rates have also averaged 4-6% in recent years (see chart below for the year-over-year Indian CPI inflation rate). The “real” implied earnings growth rate might be 12-15%, judging from history.
TradingEconomics.com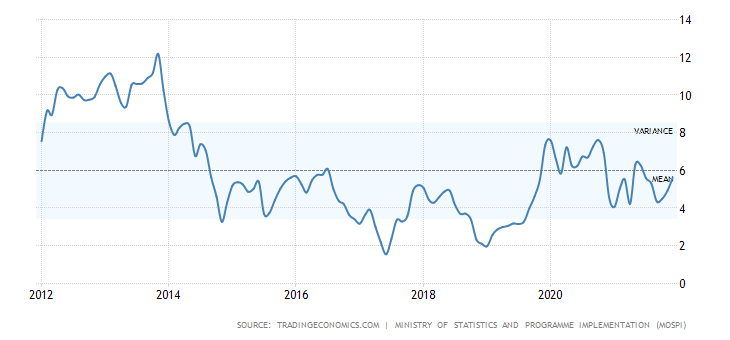
Based on MSCI’s forward and trailing price/earnings ratios, there is also a significant boost on a one-year forward basis, so my earnings assumption is far lower than this year one after accounting for this “post-COVID” bounce.
Cost of Equity Estimate for SMIN
Professor Damodaran has estimated the mature market equity risk premium as being 4.90% (as of recent), with a country risk premium as of January 2022 of 2.18% for India. The sum is 7.08%. The 10-year Indian government bond yield is presently 6.62%, which could be viewed as the local risk-free rate for long-term equity investors. The sum of 7.08% and 6.62% is 13.7%, which would be our cost of equity for SMIN. That is, at least; we are not including any additional small-cap risk premium here, but it’s a starting point.
SMIN Short-term Valuation Gauge
Based on the above data, SMIN is probably significantly overvalued.
Author’s Calculations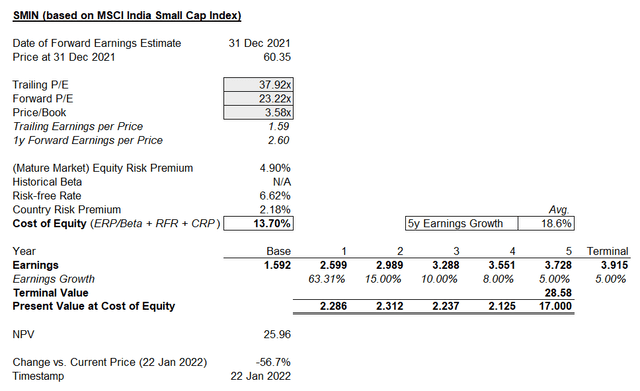
I haven’t covered SMIN before, but the low forward earnings yield (in spite of the earnings boost projected) would seem to lend support to my estimation. In order to solve for fair value, the cost of equity would have to instead be something like 6.22%, which would be on par with the U.S. cost of equity. So, it would appear that SMIN is being priced like a lower-risk (or average and diversified) U.S. equity fund, not as a small-cap emerging market equity fund.
SMIN has enjoyed recent inflows, and seems to be well positioned cyclically, but the valuation is preclusive for me. I would be unsurprised to see SMIN drag against SPY and other popular U.S. equity funds (for example), because the valuation is simply too pricey. Earnings growth is not enough to reclaim the valuation either: even if I assumed 15% earnings growth per annum after the year-one boost projected by MSCI, the valuation would still indicate -47% downside potential. The problem here is an under-pricing of regional risk.
In short, even if earnings out-perform significantly over the medium- to long-term, SMIN is still likely to end up being overvalued. I am forced to take a bearish stance.
[ad_2]
Source links Google News

