[ad_1]

ayo888/iStock via Getty Images
Price and value are inseparable. People pay amounts commensurate with expected benefits to be derived from the product or service. Inevitably, instances arise where the expected benefits, the value, falls short of the price paid.
With an activity as complex as analyzing securities for potential investment, NOT getting what was paid for is common. This is especially true in the case of exchange traded funds. ETFs cost money to construct, manage, and maintain. These operating expenses add insult to injury when the ETF under-performs relevant benchmarks.
Such has been the case with the actively managed small-cap ETF from AlphaMark (SMCP). My intent with this article is to review historical performance of the fund and explore what the future may hold. Bottom line up front: SMCP has an outrageous expense ratio. Even without expenses, the fund has woefully underperformed its benchmarks. Do not buy.
Fund Objective and Composition
Run by Michael L. Simon, President and Chief Investment Advisor of AlphaMark, SMCP invests 80% of its assets in small-cap companies. It does this primarily through the purchase of various ETFs, most of which have a particular geography, sector, or style that the fund manager believes is attractive given world economic conditions. A key objective of the fund is to choose those securities that will “reduce the inherent volatility of owning individual small cap stocks by being highly diversified.” The expense ratio of the fund is 1.22%, putting it in the 99th percentile of all 7,600 ETFs in the world, and well above the actively managed ETF average of 0.69%.
The fund currently holds six different securities, five of which are other ETFs (all of them from iShares), and one individual company stock:

alphamark advisors
These will each be discussed in some detail later.
An inherent issue with an ETF that primarily consists of other ETFs is that the advisor is of course on the hook to pay the expenses associated with the management of those other ETFs. Here is a breakdown of expense ratios of the ETFs within the ETF:
| EEMS | IWM | IWN | IWO | SCZ |
| 0.68% | 0.19% | 0.24% | 0.24% | 0.39% |
*Data compiled by author using data from SeekingAlpha
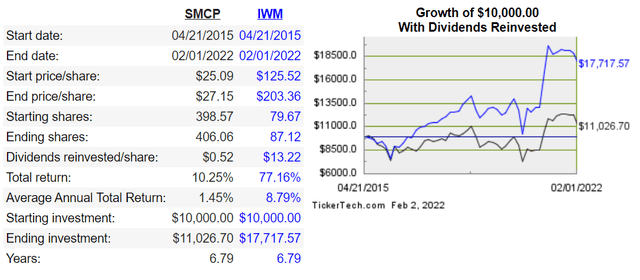
The weighted average of these is 0.32%, on top of the 1.22% already mentioned. These expenses alone are more than enough to result in considerable underperformance against a benchmark when measured over many years. But when coupled with poor active management, the results have been truly dismal (IWM = iShares Russell 2000 ETF, the benchmark):
Dividend Channel
At 1.45% annualized return, SMCP hasn’t even kept up with inflation, which averaged 2.3% over the same period. A closer look at individual holdings explains the poor performance.
Holdings
The largest holding in SMCP is the iShares Russell 2000 Value Index Fund (IWN). While many investors may think they understand the general point of a “value” fund, getting into the details is vital since different institutions and fund managers each have their own flavor of what value means. Interestingly, the criteria used for inclusion in this particular value index is that the companies must have…
…lower price-to-book ratios and lower forecasted growth relative to all issuers included in the Russell 2000 Index.
While the low P/B aspect is no surprise, “lower forecasted growth” is not exactly something I think most investors would want. Isn’t investing all about growth?
The peculiarity notwithstanding, IWN hasn’t performed too terribly against the benchmark:
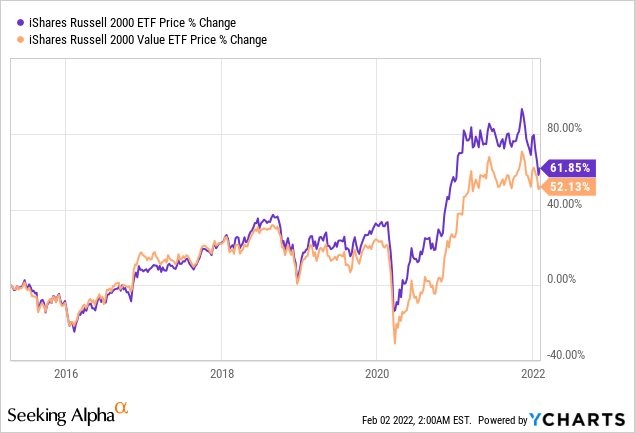
That’s an 8.41% annualized return for the value ETF vs. 8.77% for the Russell 2000.
A core problem with value ETFs is that stocks that perform well will rise all the way out of the index. As undervalued securities become discovered and heavy buying ensues, all valuation metrics will rise with the price, thus disqualifying them from being in that index. All subsequent gains will then be lost! It is for this reason that “value” ETFs have never made sense to me. The very point of buying undervalued stocks is for those stocks to one day NOT be undervalued. Only holding undervalued stocks perpetually is a recipe for failure, by definition, yet “value” ETFs do just that. Sell when it starts to do well seems like a poor way to make money. It is cutting the flowers to water the weeds, on a large scale across hundreds of holdings. This perhaps explains the underperformance.
– The second largest holding is the iShares Russell 2000 Growth Index Fund (IWO). This ETF is the exact opposite of the value ETF discussed above, focusing on companies with…
…higher price-to-book ratios and higher forecasted growth relative to all issuers included in the Russell 2000 Index.
Here is where it gets really silly. The value ETF has 1,447 stocks in it. The growth ETF has the polar opposite strategy and has 1,245 stocks in it. Both are based on the Russell 2000, which of course has 2000 stocks in it. In other words, between these two funds, every single stock in the Russell 2000 is represented. So why not just do a plain old vanilla Russell 2000 ETF and be done with it, especially when the value and growth ETFs having higher expense ratios!
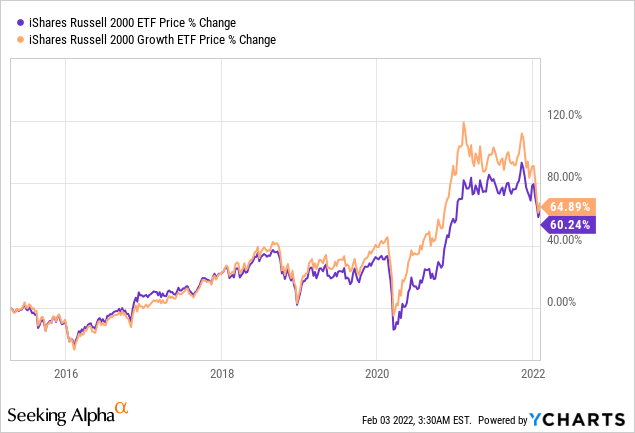
I understand the general strategy here. The portfolio manager is weighting different themes based on his assessment of the macro environment. Clearly he believes that value will do better in this environment based on the value ETFs 44% weight in the ETF vs. 24% for the growth ETF. But given the funds awful track record, I am not confident in his ability to be playing that game. Indeed, had he weighted more towards growth in the past his fund would be doing much better today, as the growth ETF has beat the benchmark, sometimes widely:
The third largest holding in the Fund is the iShares MSCI Emerging Markets Small Cap ETF (EEMS). The name explains itself, with holdings from these developing economies:
Argentina, Brazil, Chile, China, Colombia, Czech Republic, Egypt, Greece, Hungary, India, Indonesia, Kuwait, Malaysia, Mexico, Pakistan, Peru, the Philippines, Poland, Qatar, Russia, Saudi Arabia, South Africa, South Korea, Taiwan, Thailand, Turkey and the United Arab Emirates.
The performance here has been woeful:
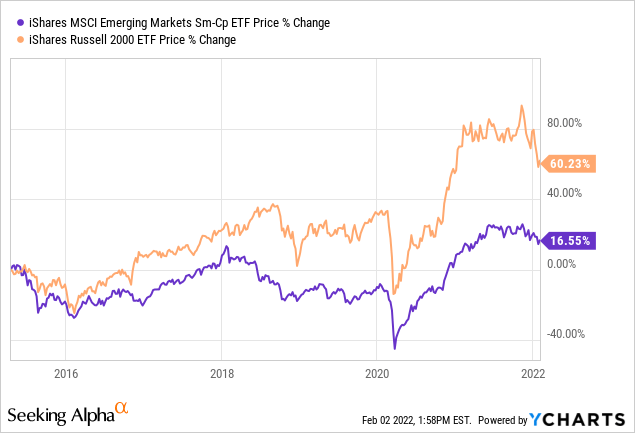
Investors have paid dearly to lose their money, as this ETF has the highest expense ratio of all within the larger fund, at 0.68%.
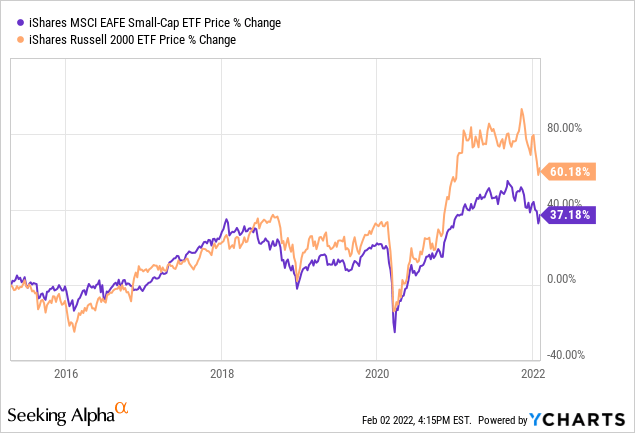
The fourth largest holding in the ETF is the iShares MSCI EAFE Small-Cap ETF (SCZ). EAFE stands for Europe, Australasia, and Far East. It consists of developed market equities excepting Canada and the Americas. Due to the unique business climate in America not present elsewhere, international equities tend to generally do worse than what is in the United States. There is a reason the United States has the world’s largest and strongest economy in spite of being one of the youngest countries:
Many investors emphasize having some international exposure. Their logic is that more than half of the investable world is in companies outside the United States, so not having money there isn’t true diversification. But diversification for diversifications sake is not a sound strategy. Take a look at the performance of the three largest total world ex-U.S. ETFs vs. both the S&P 500 and the Russell 3000:
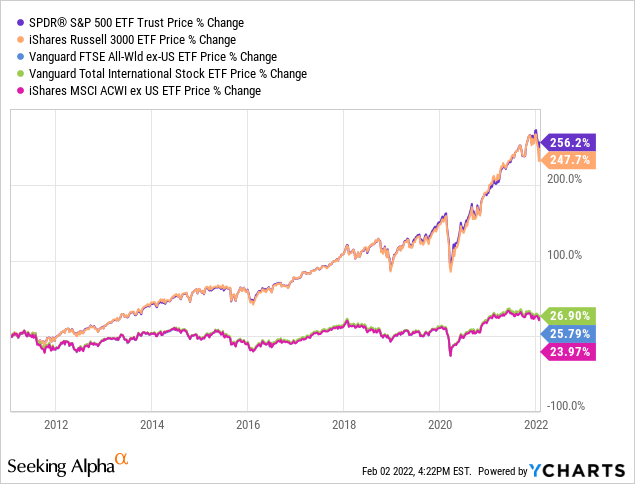
It’s not even close. While I don’t deny that there are always pockets of opportunity internationally, investing internationally just because there are stocks there is an odd strategy. I don’t eat everywhere there is food because some places have bad food.
Forgive that tangent, but the point is that this EAFE ETF has pulled down the overall performance of SMCP, and historically speaking this could have been predicted and therefore avoided.
The fifth largest holding in SMCP is just a normal Russell 2000 ETF offered by iShares, and it need not be discussed apart from the fact that an identical ETF is offered from Vanguard that has a lower expense ratio, 0.1% vs. 0.19%. Why AlphaMark has deliberately selected only iShares products is peculiar.
The final holding is an individual name, Orbital Energy Group (OEG). This company operates in two segments, one that “provides engineering, procurement and construction (“EPC”) services that support the development of renewable energy generation focused on utility-scale solar construction”. The other segment brands themselves as “leaders in innovative gas solutions, with more than 30 years of experience in design, installation and the commissioning of industrial gas sampling, measurement and delivery systems.”
It is beyond the intent of this article to do a thorough analysis of the company, but I do have some thoughts on why this stock, of all the small-caps in the world, would be chosen by the portfolio manager.
While OEG has been burning cash since 2012, they are in the midst of transforming their business, having sold off several assets in the past few years and scooping up several others. This is because a new CEO took over in 2019 that is taking things in a new direction. There is therefore execution risk here, but the portfolio manager of SMCP is probably bullish on this stock because of what he perceives to be a couple macro tailwinds: the renewable energy “megatrend” and the emphasis by the current administration on infrastructure. Both could be a huge benefit to OEG. Time will tell. In any case, Orbital’s CEO seems to be uber bullish on his company. He has bought 555,000 shares in open market transactions in the last three months, more than doubling his ownership position which stands now at 1.8% of the company. Again, we will see if this will have been worth it.
All told, every single holding in the ETF has underperformed its benchmark since inception of the fund. I have little faith anything will change looking forward.
Conclusion
Not all ETFs are created equal. In the case of SMCP, I am of the opinion it shouldn’t even exist. A full 73% of the fund is simply the Russell 2000, albeit weighted toward value. The remaining 27% has been more than enough to drag down the performance of the ETF so that it not only lags the benchmark, but it also hasn’t even beat inflation. What’s worse, the company in charge of the ETF charges a very high expense ratio. Investors have literally paid someone else to lose money for them.
As a recap, high fees can kill returns. Diversification for diversification’s sake isn’t a good strategy. Not all ETFs are created equal. Do research on what you buy, since headlines and titles are no indicator of what is going on underneath.
[ad_2]
Source links Google News

