[ad_1]

Eoneren/E+ via Getty Images
The Simplify US Equity PLUS Downside Convexity ETF (SPD) is long the S&P 500 and seeks to protect this position against market selloffs through owning a ladder of far OTM puts. The option overlay can protect against market crashes, but the speed of the crash affects the extent of protection. Overall, SPD is a safe long-term hold.
How SPD Works
A quick glance at SPD’s holdings on Simplify’s website shows the general idea of this fund. Most of the capital is invested in the iShares Core S&P 500 ETF (IVV) to represent an investment in the S&P 500 (SPX). IVV is a slightly better choice than SPY because its expense ratio of 0.03% is three times lower than SPY’s 0.0945%. This ~98% allocation in IVV means SPD’s returns will very closely track that of the SPX.
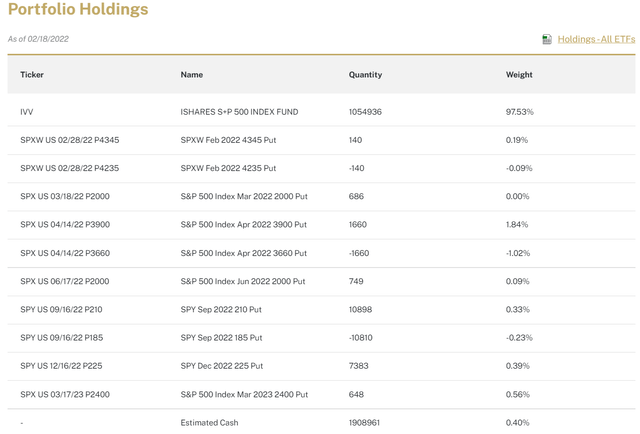
SPD Holdings (Simplify)
The remaining two percent is allocated into a hedge comprised of SPY and SPX put options. These two underlyings have the most liquid options, making it easy to enter and exit positions. Notice that each put’s strike price is very far from the current price of SPY or SPX. Further OTM options exhibit greater convexity. When the underlying moves closer to the strike price, these option prices tend to increase very quickly.
In the case of OTM puts on indices and index ETFs, the underlying moving closer to the strike price is also accompanied by an increase in implied volatility, which increases the value of all options. Therefore, far OTM puts exhibit a special, compounded price appreciation when markets are selling off. This is what makes them such a powerful hedge for market crashes. The idea is that as the “stocks” portion of one’s portfolio is decreasing with the market, the “hedge” portion will multiply and fill the gap created by the depressed stocks. One could then exit the hedge and use the profit to buy stocks, now significantly lower, and rebalance the portfolio. The total value of the portfolio would have not changed much, meaning the hedge has effectively protected the investor from the loss caused by a serious market selloff. I discuss puts, volatility, and convex hedging in more detail in this article.
Does the Hedge Work?
A simple way to examine how a put option hedge helps a portfolio during a crash is to check the factor by which the hedge increases and see whether the initial allocation of the hedge could satisfactorily fill the gap created by the selloff. In SPD’s case, this allocation is meant to be about 2% of the portfolio.
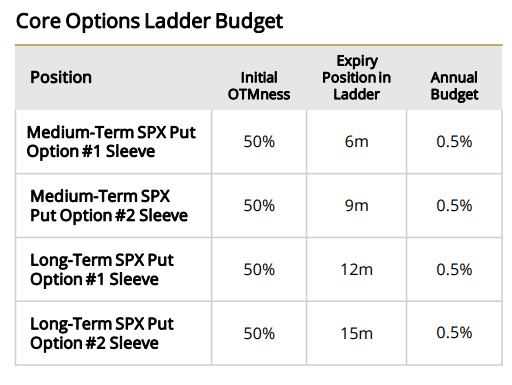
SPD Options Concept (SPD Factsheet)
The factsheet shows that SPD uses an options ladder of 50% OTM puts. It intends for there at least to be a put which expires in 6 months, and then every three months going up until 15 months. SPD allocates about 50 basis points annually to each maturity. If we assume SPD has about 2% allocated into the hedge, the following chart indicates the multiple that 2% must increase by to protect the portfolio against a certain drawdown.
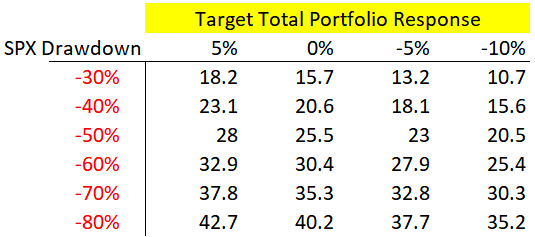
Matrix of required multiples for a 2% hedge to protect against a certain drawdown. (Calculations by Author)
For example, if we wanted a return of 5% for the total portfolio while the SPX suffers a 30% drawdown, a 2% allocation into the hedge and 98% allocation into SPX means the hedge’s value must multiply by 18.2. This chart gives us a good check. If SPD’s puts can hit these numbers, then we know the SPX drawdown we would be protected from, and to what extent the protection covers.
A closer look at the holdings shows that SPD also has contracts sold short. These are likely attempts to pay for the cost of hedging. In fact, each short contract listed can be paired with at least one long contract with the same expiry to create a debit spread. If the market falls through the strikes, the total spread would be worth the difference between the strike prices. The spread can then be sold to buy more IVV, like in the rebalance procedure mentioned above. In general, the debit spreads, especially those with strikes closer to the spot price, do not play a major role in market crashes (30% or greater drawdown in the SPX). Because they have a capped value at the difference between the strikes, they will not exhibit the convexity that leads to effective protection. The volatility boost to options during a crash will also be capped because the spread is both long and short options.
With that said, we can now isolate the OTM puts which are clearly not part of a debit spread and evaluate them as a hedge on their own. Empirically, 50% OTM puts have incredible convexity. Here, I look at three puts that were each around 50% OTM right before the stock market began its downturn in 2007-2009. October 8, 2007 is around that top, give or take a few weeks. On that day, the SPX was around 1500 and the expiries of the 800 strike puts which would expire in at least 5 months included: 2008-06-21 (8 months), 2008-12-20 (14 months), 2009-12-19 (26 months). Below, I plot the time series of bids and offers for each of them after October 8, 2007. Because the horizontal axis is denoted by trading days, around the 252-day mark would be October 8, 2008 (there are about 252 trading days in a year). The rightmost endpoint of each curve is the expiration date for the options.
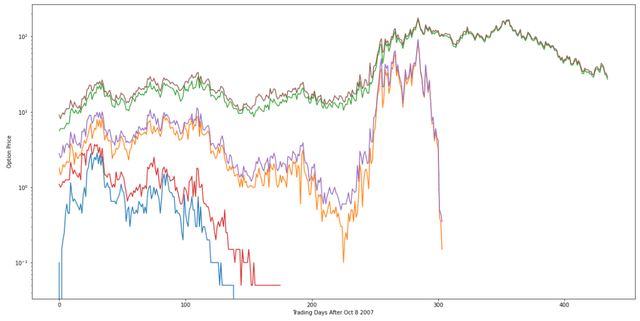
Time series of three OTM put prices starting from OCT 8 2007 (Data from OptionMetrics, Chart by Author via Python)
Because the vertical scale is logarithmic, each time a curve goes from one power of 10 to another (i.e., passes from one tick mark to the one above it), the price of the option has multiplied by a factor of 10 between those two points. This graph gives a good visual on how options of different maturities changed over the course of the market crash. Because put prices monotonically decrease as strikes decrease, and monotonically increase as time increases, one can use the plotted curves as pegs to determine how a slightly different put (in strike or time to expiry) would have been priced.
Of note, the 8-month put was not a 10-bagger. Both the 14 and 26-month puts each managed to 10x at some point. The parabolic rise for the 14-month put happens right when Lehman collapsed (September 2008 or ~225 day mark on the chart above).
With these results, it seems the 14-month may well have protected the portfolio against a 40% drawdown, causing the total return to be contained within -10%. In the long run, evading a 40% loss does wonders for a portfolio’s compound annual growth rate. 2008 was a more drawn-out crash with many different parts to it.
The March 2020 crash was much faster. I do the same graphing for 2020. The puts used are also about 50% OTM. In early January 2020, the SPX was just over 3200. The puts used each have a strike of 1650. Their expirations are: 2020-05-15 (5 months), 2020-09-30 (10 months), 2020-12-31 (12 months). I graph them in the same manner as above. Because the lines are so close together, I only use the offer price, so it is easier to differentiate between options. Again, the rightmost endpoint is the expiration date of the option. I also show the linear scaled vertical axis graph.
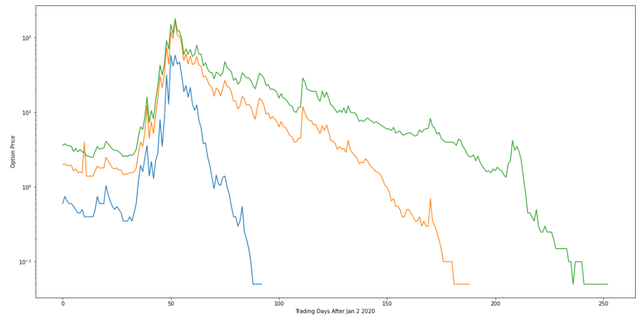
Time series of three OTM put prices starting from JAN 2 2020 (Data from OptionMetrics, Chart by Author via Python)
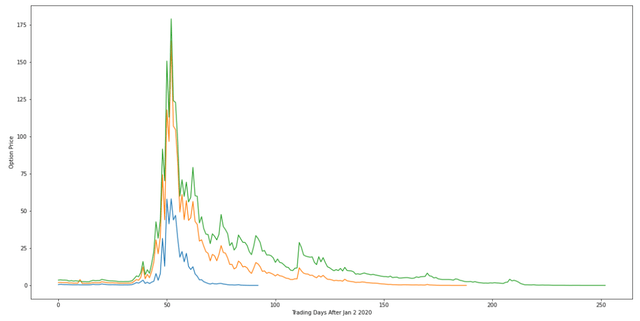
Time series of three OTM put prices starting from JAN 2 2020 (linear scale) (Data from OptionMetrics, Chart by Author via Python)
The swiftness of this market crash allowed the 12-month put to become nearly a 32-bagger (3.6 offer price on January 2nd to a max of 115.1). And the 5-month put to become a 93-bagger (0.6 offer price on January 2nd to a max bid of 55.8).
Here, the puts with closer expirations stand out. Each put was over a 30-bagger. The numbers indicate that a 60% crash would have been completely protected against given any combination of these puts in a 2% allocation to the hedge. Since the SPX crashed just -33%, SPD’s price probably would have substantially increased if it had been around during the 2020 crash.
In conclusion, the hedge works, but it works better when a crash happens rapidly. A slow, drawn-out market selloff would mean little opportunity to monetize the hedge despite having paid for the hedge for the years leading up to the selloff. This would be the biggest issue with owning SPD.
SPD as an Investment
SPD, in my view, is a safer long-term hold than simply IVV or SPY. Its ETF wrapper encapsulates a working strategy for hedging against market crashes and preserving long-term CAGR. Its biggest issue would be a drawn-out selloff. If the selloff happened over the course of a few weeks, like in March 2020, SPD’s convex hedges would likely increase dramatically and bring the whole fund to a higher NAV than it was before the crash. In many ways, this is a great position. Sudden events which spook the market and induce extreme volatility would actually be highly beneficial. This makes SPD a valuable source of diversification when diversification is most needed.
A case can be made for occasionally switching between SPD and IVV or SPY. Immediately after a market crash, an unhedged fund would certainly offer superior returns for an extended period. When the market presents signs of unease, selling some SPY and replacing it with SPD might be a more risk-averse move. For example, if an inverted yield curve signals recession, then one might consider switching half of their SPY for SPD when inversions occur. Regardless, SPD volatility should be lower than SPY in the long term, though its returns may not necessarily be less due to its ability to preserve CAGR during a crash. Safe Hold.
[ad_2]
Source links Google News

