
[ad_1]
asbe/iStock via Getty Images
Throughout most of 2021, the US central bank and administration called rising prices a “transitory” economic event. Towards the end of last year, the Federal Reserve had an epiphany when the consumer and producer price indices reached the highest level in decades. Instead of taking immediate action, the FOMC attempted to talk tough to put a leash on inflationary pressures. They waited until March 2022 to push the short-term Fed Funds rate above the zero level for the first time since the start of the global pandemic.
Artificially low interest rates, a tidal wave of liquidity, and government stimulus programs with a tsunami of payments to businesses and individuals planted inflationary seeds that began to spout in 2020 and moved into full bloom in 2021 and 2022. The first major war in Europe since the end of World War II exacerbated the upward trajectory of prices.
The Fed is now pushing rates higher after the March consumer and producer price data showed the highest inflation in four decades. The central bank is chasing an inflationary beast with monetary policy, but it is far behind the economic condition.
Selecting assets that will perform as inflation rises is a challenge. I favor precious metals, and my leading candidate for the rest of 2022 is the ETFMG Prime Junior Silver Miners ETF product (NYSEARCA:SILJ), as it follows the silver price, an inflation barometer. Moreover, silver mining stocks tend to outperform silver during rallies, and the junior miners often turbocharge the percentage gains of the senior mining companies. I view SILJ as a high inflation hedge or product that could experience an explosive increase from its current price level at the $12.29 per share level on April 29.
Inflation Is An Ugly Beast
Central bank liquidity, government stimulus, and the first major war in Europe since World War II have created a potent inflationary trend, and trends tend to be your best friend.
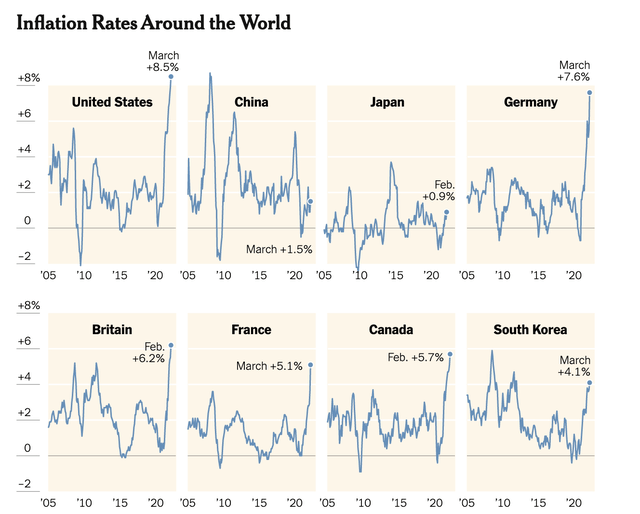
Inflation Rates (New York Times)
As the chart highlights, rising prices caused the US consumer price index to increase by 8.5% in March. The measure of producer prices grew by 11.2%. The key US inflation indicators are at the highest level in over four decades. Inflation is causing the cost of all goods and services to rise. While wages have moved higher, they have not kept pace with inflation, which has caused financial pressures on a growing number of consumers. Historically, rising inflation has created political unrest and toppled governments. The most glaring example was the post- WW I hyperinflation in Germany, leading to the rise of the Nazi Party and WW II. Inflation is an ugly economic condition with political consequences.
The Economic Condition Feeds On Itself
Inflation can spiral into a vicious cycle of rising prices. As input costs increase, manufacturers push prices higher to keep pace with growing expenses. As finished product prices rise, it can cause those inputs to increase to even higher levels. Meanwhile, as the cost of living moves to the upside, workers demand higher wages, creating a circle fueling even higher inflation.
Inflation can be a cancer that spreads through all sectors of the economy. In 2022, the condition continues to increase because the central banks were slow to react to the signs that began flashing during the second half of 2020 and throughout 2021. Many economists warned that interest rates were too low last year, and the inflation trend had become dangerous. While central bank and government economists waited for data, they fell far behind the inflationary curve. The US Fed only began increasing the short-term Fed Funds Rate in March 2022. On May 4, they will likely increase it by 50-basis points to 0.75% to 1.00%, which is far below CPI and PPI. Real rates will remain in negative territory, fueling even more inflationary pressures in the coming months.
While the US Fed controls short-term interest rates, the US bond market determines the levels further out along the yield curve. Bonds had been flashing warning signs since July 2021, when the long bond futures began their descent.

Chart of the US 30-Year Treasury Bond Futures (Barchart)
The chart shows the decline in the long bond futures to 138-14, the lowest level since November 2018. The long bond is approaching a critical technical support level at the October 2018 136-16 low. The futures were close to the recent low at the 140-22 level at the end of April.
Gold Is The Oldest Inflation Barometer, But Silver Tends To Outperform On The Upside During Significant Rallies
Gold is a currency and a commodity. While the metal has industrial and ornamental applications, central banks, governments, and monetary authorities worldwide hold gold as an integral part of their foreign currency reserves, validating gold’s role in the financial system. Over the past years, governments have been net buyers of the metal to increase reserves. Long before dollars, euros, pounds, and the other currencies were means of exchange, gold was the ultimate form of money. As inflation erodes fiat currencies’ purchasing power, gold stands out as an asset that is a store of value.
The events in Ukraine and sanctions on Russia have led Moscow to declare that 5,000 rubles are exchangeable for one gram of gold. If Moscow and Beijing’s “no-limits” cooperation leads China to back its yuan with gold, the metal’s role in the global financial system will grow. While governments can increase fiat currency supplies to their heart’s content, increasing the gold supply is only possible by extracting more metal from the earth’s crust.
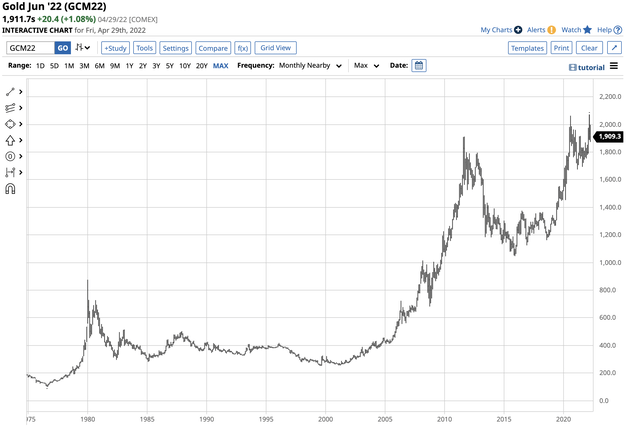
Long-term Gold Futures Chart (Barchart)
The chart illustrates the bullish trend in gold since the 1999 low. Over the past twenty-three years, gold moved from $252.50 per ounce to the most recent high of $2072 in March 2022. At over the $1910 level at the end of April, the bullish path of least resistance remains intact.
Gold’s rise is a commentary on the decline in purchasing power for the US dollar and other fiat currencies.
Governments once held silver, but they abandoned using the metal as a reserve currency because of its price volatility. However, silver tends to follow gold higher and often outperforms the yellow metal during substantial rallies. In March 2020, gold fell to $1452.10 as the global pandemic caused selling to grip markets across all asset classes. By August 2020, gold exploded to a high of $2063 per ounce, a 41% gain in five months. Over the same period, silver’s price fell to $11.735 and moved 151.6% higher to $29.53. Silver outperformed gold by over three and one-half times during the 2020 rally.
Speculators often flock to the silver market when the price trends higher or lower. From March 2020 through August 2020, the speculative interest pushed silver far higher than gold on a percentage basis. If the precious metals are inflation barometers, we could see a similar move over the coming months and years. The inflation of the late 1970s and 1980 pushed silver to a record $50.36 per ounce. The inflation that followed the 2008 global financial crisis sent silver prices to a slightly lower high of $49.52 per ounce in 2011. If inflation sends gold’s price to new heights, silver could become explosive.
Silver Mining Companies Provide Leverage To Silver, And Junior Mining Companies Are More Volatile Than The Seniors
Gold and silver mining companies tend to outperform the metal prices on the upside and underperform when prices decline, providing leverage to the precious metals prices. Mining companies invest capital based on price forecasts; they earn more profits when the price increases above expectations and vice versa. Senior mining companies produce the metals, while junior miners explore for deposits. The junior miners often provide even more leverage than the senior miners because of the risks involved in exploration.
While mining shares offer leverage, they do not suffer from the time decay that many other highly geared market products suffer. Mining companies move higher and lower with the metal prices, but most will remain in business when the prices correct to the downside. Meanwhile, when prices rise, they can extract lower grade ores with higher production costs from the earth’s crude, increasing profitability and the demand for new reserves.
In silver, the mining shares reflect the higher volatility of silver compared to gold, and the junior miners’ shares experience implosive to explosive price movement.
The SILJ Is A Diversified Route To Leverage And My Favorite Pick For A High Inflation Play
When silver rallied from 151.6% from March through August 2020, the Global X Silver Miners ETF (SIL) rallied from $16.00 to $52.87 per share or 230.4%, outperforming silver during the explosive period. The ETFMG Prime Junior Silver Miners ETF product (SILJ) did even better because of the leverage of the junior mining companies that explore for silver.
The top holdings of SILJ include:
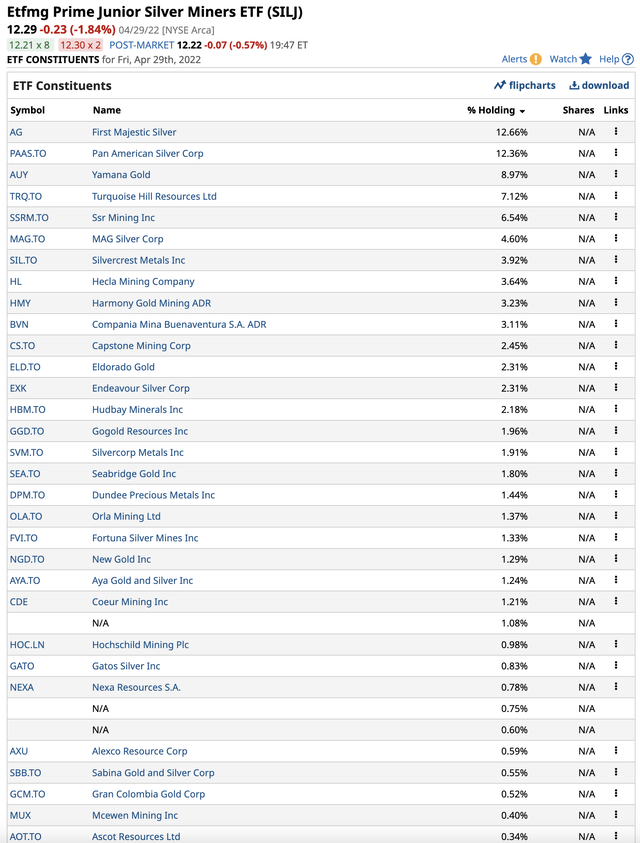
Top Holdings of the SILJ Junior Silver Miners ETF Product (Barchart)
At $12.29 per share on April 29, SILJ had $855.173 million in assets under management. The ETF trades an average of over two million shares each day and charges a 0.69% management fee. It offered shareholders a nominal $0.05 dividend, translating to a 0.41% yield.
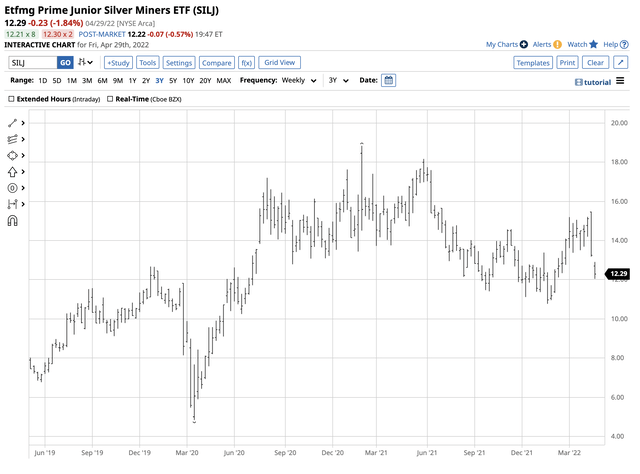
Chart of the SILJ Junior Silver Miners ETF Product (Barchart)
The chart illustrates the rally from $4.84 in March 2020 to a high of $17.21 in August 2020, a 255.6% move to the upside. SILJ peaked at $18.84 in early February 2021 when silver probed above the $30 per ounce level for the first time since 2013. The SIL ETF only managed a lower high when silver reached the February 2021 peak.
Silver tends to turbocharge the percentage gains in gold on the upside, and senior silver miners often do even better on a percentage basis. The junior miners can outperform the seniors when the price takes off on the upside.
Silver and gold are inflation barometers. With the Fed and other central banks far behind the inflationary curve, the prospects for higher silver and gold prices remain high. At $12.29 per share on April 29, I view the SILJ ETF product as a call option on higher silver prices in an inflationary environment without time decay or an expiration date. SILJ is my favorite play for rising inflation over the coming years as the volatile silver market has the potential to soar and visit the 2011 and 1980 highs at the $50 per ounce level or higher. SILJ shares could triple or more from the current level at those silver prices.
[ad_2]
Source links Google News