[ad_1]
Global X Silver Miners ETF (SIL) is a collection of mostly small- and mid-cap mining companies with significant exposure to silver, although many also produce other precious metals. The exchange-traded fund with over $325 million in assets under management has an expense ratio of 0.65% comparable to other industry focused equity ETFs. SIL offers investors exposure to companies that are typically leveraged to the spot commodity price and themes in broader industrial mining. The ETF should outperform silver to the upside but has higher risk overall. Indeed, SIL is down about 21% over the past year while the iShares Silver Trust ETF (SLV) is down 12% over the same period. This article highlights the performance of the underlying holdings for SIL along with commentary on the market outlook and developments for silver.

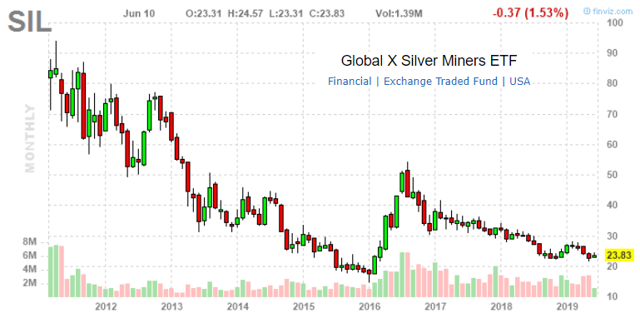
SIL monthly price chart. Source: Finviz.com
Silver Market
Looking back over the past decade when silver traded near $50 an ounce back in 2011, it’s been an overall painfully steady downtrend in recent years with the commodity spot price reaching a low under $14 an ounce in early 2016. The current spot price of $14.75 per ounce reflects still poor sentiment among concerns over global industrial demand, particularly from China. Lower than expected inflation trends around the world coupled with resilient economic growth conditions have largely limited the flight to safety qualities of all previous metals. On the other hand, global market supply and demand data suggests the silver market continues to present a small recurring supply deficit with physical demand above total supply in 5 of the past 6 years. The Silver Institute estimates another small deficit in 2019 of less than 0.5% total demand.
Mine production in 2018 at 855 million ounces has been lower in recent years and down 4.3% from a peak back in 2015. Total supply has largely been flat over the past decade however, with recently lower production balanced by declining levels of scrap inventory coming on market. Physical demand at 1,033.5 million ounces in 2018 has also been relatively little changed this decade with different demand components oscillating based on usage trends. Given the poor price performance of silver, it’s not surprising that “coins & bars” demand at 181 million ounces in 2018 was down nearly 40% compared to a peak in 2015. This makes sense as the sentiment to own silver among speculators has waned in recent years. I believe this category of buyers will return should silver prices begin to trend higher and could fuel the next bull market rally higher.
Silver market supply and demand. Source: SilverInstitute.org
Silver Miners

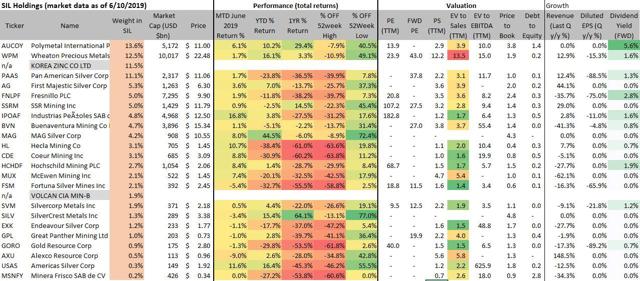
SIL ETF holdings metrics. Source: data by YCharts/table author
22 of the 24 equity holdings in SIL are companies with shares traded on a local U.S. exchange. Keep in mind that some of these stocks are otherwise thinly traded, highlighting the advantage of the ETF to gain exposure across the board. The returns above are presented on a total return basis that includes the impact of dividend. An investor holding the stocks over these periods would have attained similar results.
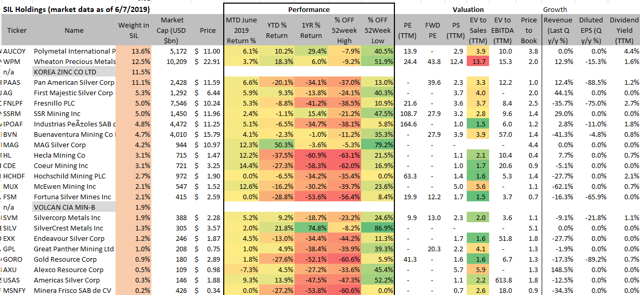
Korea Zinc Co. Ltd. and Peru’s Volcan Cia Minera are the two exceptions and do not have listed ADR or OTC shares. Of the 22 stock available for trading, 18 are down on average 35% over the past year. Helca Mining Co. (HL) and Coeur Mining Inc. (CDE) are the worst performers, down over 60% since this time in 2018. SilverCrest Metals Inc. (SILV) is the top performer over the past year, up 75%. In November of 2018, it was announced that SSR Mining Inc. (SSRM) had acquired a 9.9% stake in the company, bolstering its liquidity position.
Year to date, the numbers for the group are better with 9 holdings posting positive returns. MAG Silver Corp. (MAG) is up 45% in 2019 and an even more impressive 72% from its 52-week low. MAG is a Canada based company with mining assets in Mexico and has a market cap of $944 million. The company has posted strong operational results driven by the progress in its new Juanicipio Project, a mining project joint venture with Fresnillo Plc (OTCPK:FNLPF).
Wheaton Precious Metals (WPM) is the largest company in the silver ETF with a market cap of $10.2 billion. It has been the overall less volatile and safer bet in the group, up 3% over the past year as one of the few winners. WPM has rallied 52% from its 52-week low. The company has diversified into other precious metals in recent years and is no longer a pure-pay silver mining company but still the largest silver streamer.
SIL Analysis
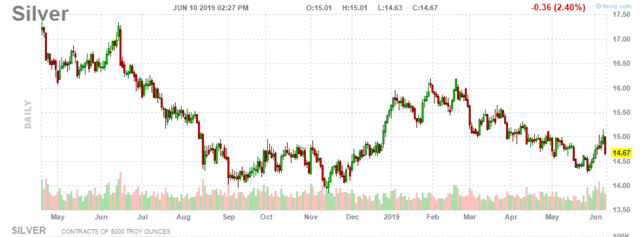
In recent months, renewed uncertainty and rising tensions from the ongoing U.S.-China trade dispute have led a bounce in precious metals and silver, but it’s still unclear if this latest bounce “has legs”. My concern is more related to the negative demand pressures on the global commodity complex from weak Chinese economic activity. In May, Chinese manufacturing PMI fell to 49.4 from 50.1 in April, suggesting a slight contraction. Recent statements by Fed governors opening the door for a easing monetary policy actions considering rising global growth uncertainty and a weaker than expected payrolls number in June have begun to pressure the Dollar. Still, I believe a slowing Chinese economy in the near term will outweigh any boost to silver and gold prices from a falling Dollar.

Silver Futures daily price chart. Source: Finviz.com
Conclusion
SIL is on my radar because I think it will be a great investment vehicle when the silver market does turn around with significant upside among the junior miners. The big question is when. I like this ETF because it’s a pure play on silver and a one-stop shop for all the major players in the industry. The exposure to foreign equities, including a number of stocks not actively traded in the U.S., is another positive.

SIL ETF key stats. Source: YCharts.com
Silver miners need a sustained rally in silver prices to enter a new trend higher. The $28 price level for SIL corresponding to a spot silver spot price of approximately $16 per ounce in recent trading represents a major level of technical resistance that needs to beak to confirm improving sentiment.
Disclosure: I am/we are long SIL. I wrote this article myself, and it expresses my own opinions. I am not receiving compensation for it (other than from Seeking Alpha). I have no business relationship with any company whose stock is mentioned in this article.
[ad_2]
Source link Google News


